


1. Executive Research Summary
- Global email usage reached 376.4 billion daily messages in 2025, representing ~4% CAGR since 2018, with volume projected to reach 392.5 billion in 2026 and 408.2 billion by 2027 (global benchmark data, 2025–2027).

- Email adoption continued expanding in 2025, reaching 4.59 billion users worldwide (56% of global population), with net growth of ~100 million users annually driven primarily by Asia-Pacific and Middle East/Africa regions (global benchmark data, 2025).
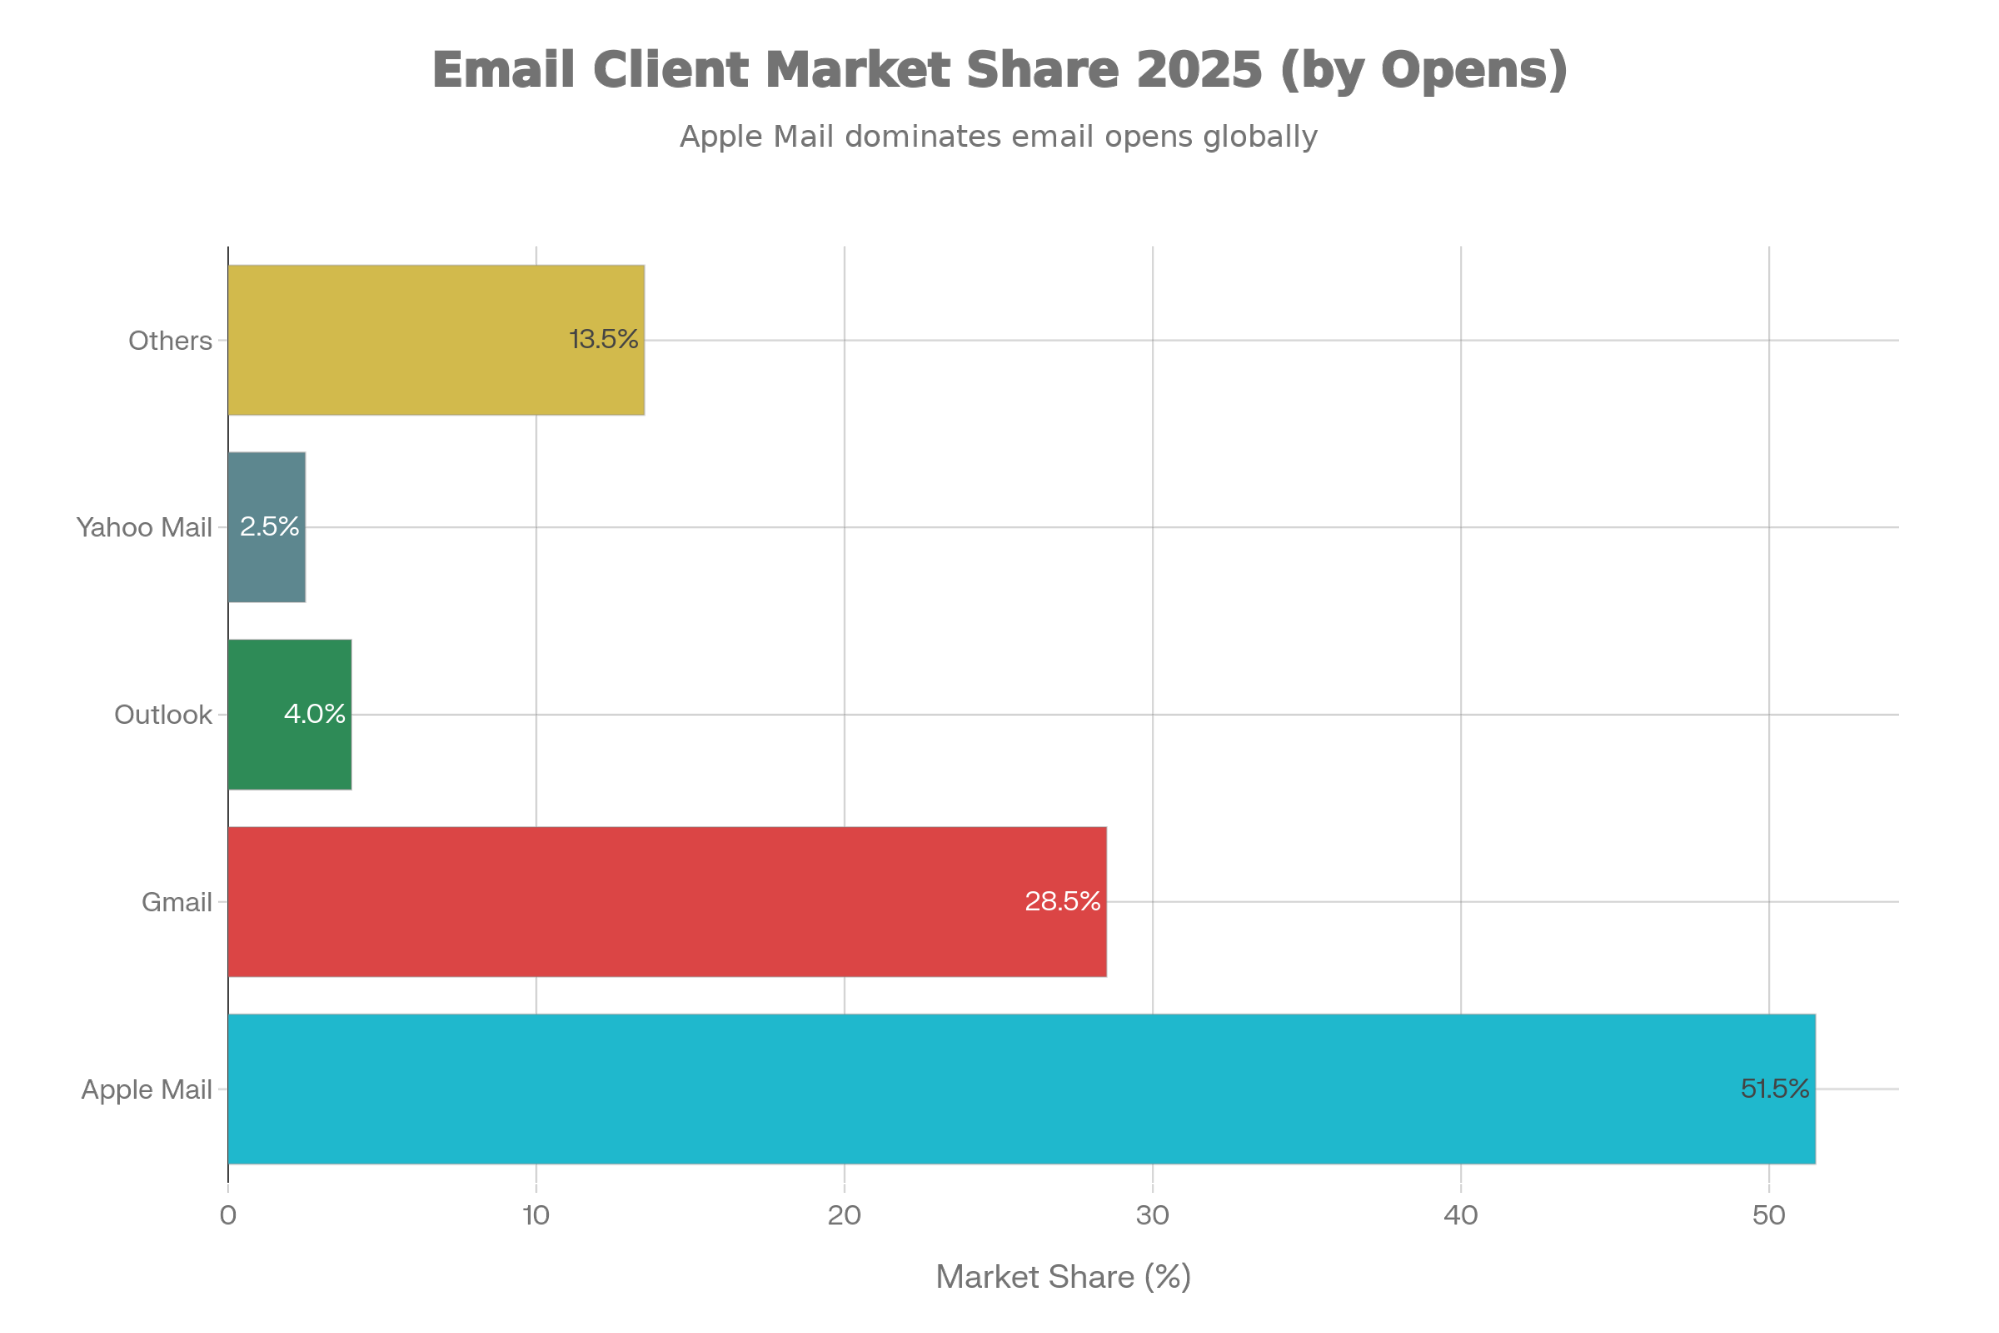
- Inbox concentration intensified, with Apple Mail accounting for ~50% of global email opens and Gmail handling ~30% of total email volume, positioning inbox providers as primary gatekeepers rather than neutral delivery channels (global benchmark data, 2025).
- Inbox overload reached critical levels, with users receiving 82–120 emails per day and 70% of professionals identifying email as their primary workplace stressor (global benchmark data, 2025).
- Original Clean Email Q1 2025 behavioral research (10,292 users; ~500,000 emails) found that legitimate, well-known brands now account for the majority of spam-flagging actions, surpassing malicious or fraudulent senders.
- Essential digital services (e.g., financial, identity, platform accounts) were more likely to be unsubscribed from, while non-essential consumer brands were disproportionately spam-flagged, indicating strategic user decision-making rather than indiscriminate disengagement (Clean Email study, Q1 2025).

2. Methodology & Data Sources
Timeframe
- Observed data: January–December 2025
- Projections: 2026–2027 (trend-based extrapolation from historical growth rates)
External Benchmark Data
Aggregated from publicly available industry datasets and reports, including:
- Global email user counts and daily volume
- Provider and client market share
- Email engagement benchmarks (open rates, CTR, unsubscribe rates)
- Mobile usage and regional growth patterns
- Published ROI and automation performance studies
Original Clean Email Behavioral Study (Q1 2025)
- Sample size: 10,292 randomly selected active users
- Emails analyzed: ~500,000 total messages
- Tracked behaviors:
- Spam flagging
- Unsubscribe actions
- Sender recurrence across actions
- Data type: Observational behavioral data derived from real inbox actions
Limitations
- Sample reflects users of an inbox-management application and may over-represent high-volume inbox environments
- Geographic skew toward North America and Europe
- Behavioral actions (spam/unsubscribe) reflect revealed preference, not stated intent
- Findings indicate directional trends, not universal causality
3. Global Email Scale & Usage Trends
Email remains the largest digital communication channel by volume.
- Daily global email volume:
- 2018: 281.1 billion
- 2025: 376.4 billion
- 2026 (projected): 392.5 billion
- CAGR: ~4%
- User growth:
- 2025: 4.59 billion users
- 2026 (projected): 4.73 billion users
- Penetration: 56% of global population
- Regional distribution:
- Highest per-capita usage: North America, Western Europe
- Fastest growth: Asia-Pacific (~4.2%), Middle East/Africa (~5.1%)
- Daily inbox load:
- Average users: 82–120 emails/day
- Office workers: ~121 business emails/day
- Annual per-user volume: ~45,000 emails
- Email fatigue indicators:
- 70% of professionals cite email as top stress source
- 42% describe their inbox as “out of control”
4. Inbox Power Shift: Providers, Algorithms, and Privacy
Inbox providers now function as active intermediaries rather than passive conduits.
- Client dominance (2025):
- Apple Mail: ~48–54% of opens
- Gmail: ~27–31% of opens; ~1.8 billion active accounts
- Outlook: ~4–10% of opens (enterprise-weighted)
- Algorithmic prioritization:
- Message placement increasingly driven by predicted engagement depth
- Sender reputation alone insufficient for inbox prominence
- Privacy protections:
- Apple Mail Privacy Protection obscures open-tracking reliability
- Engagement metrics increasingly noisy and probabilistic
- Authentication as baseline:
- SPF/DKIM adoption: ~66%
- DMARC adoption: ~54%, with many at non-enforcing policies
- BIMI emerging as visual trust signal contingent on DMARC enforcement
5. Original Research: The Great Email Rebellion
Research Classification
This section presents original observational research based on real-world inbox behavior. It does not evaluate sender intent or campaign quality.
Key Finding
Legitimate brands, not malicious actors, now generate the majority of spam-flagging actions.
Spam-Flagging Hierarchy (Most Frequently Flagged)
Examples from top cohort:
- Consumer dating platforms
- Professional networking services
- Subscription retail and food brands
- Appointment and reminder services
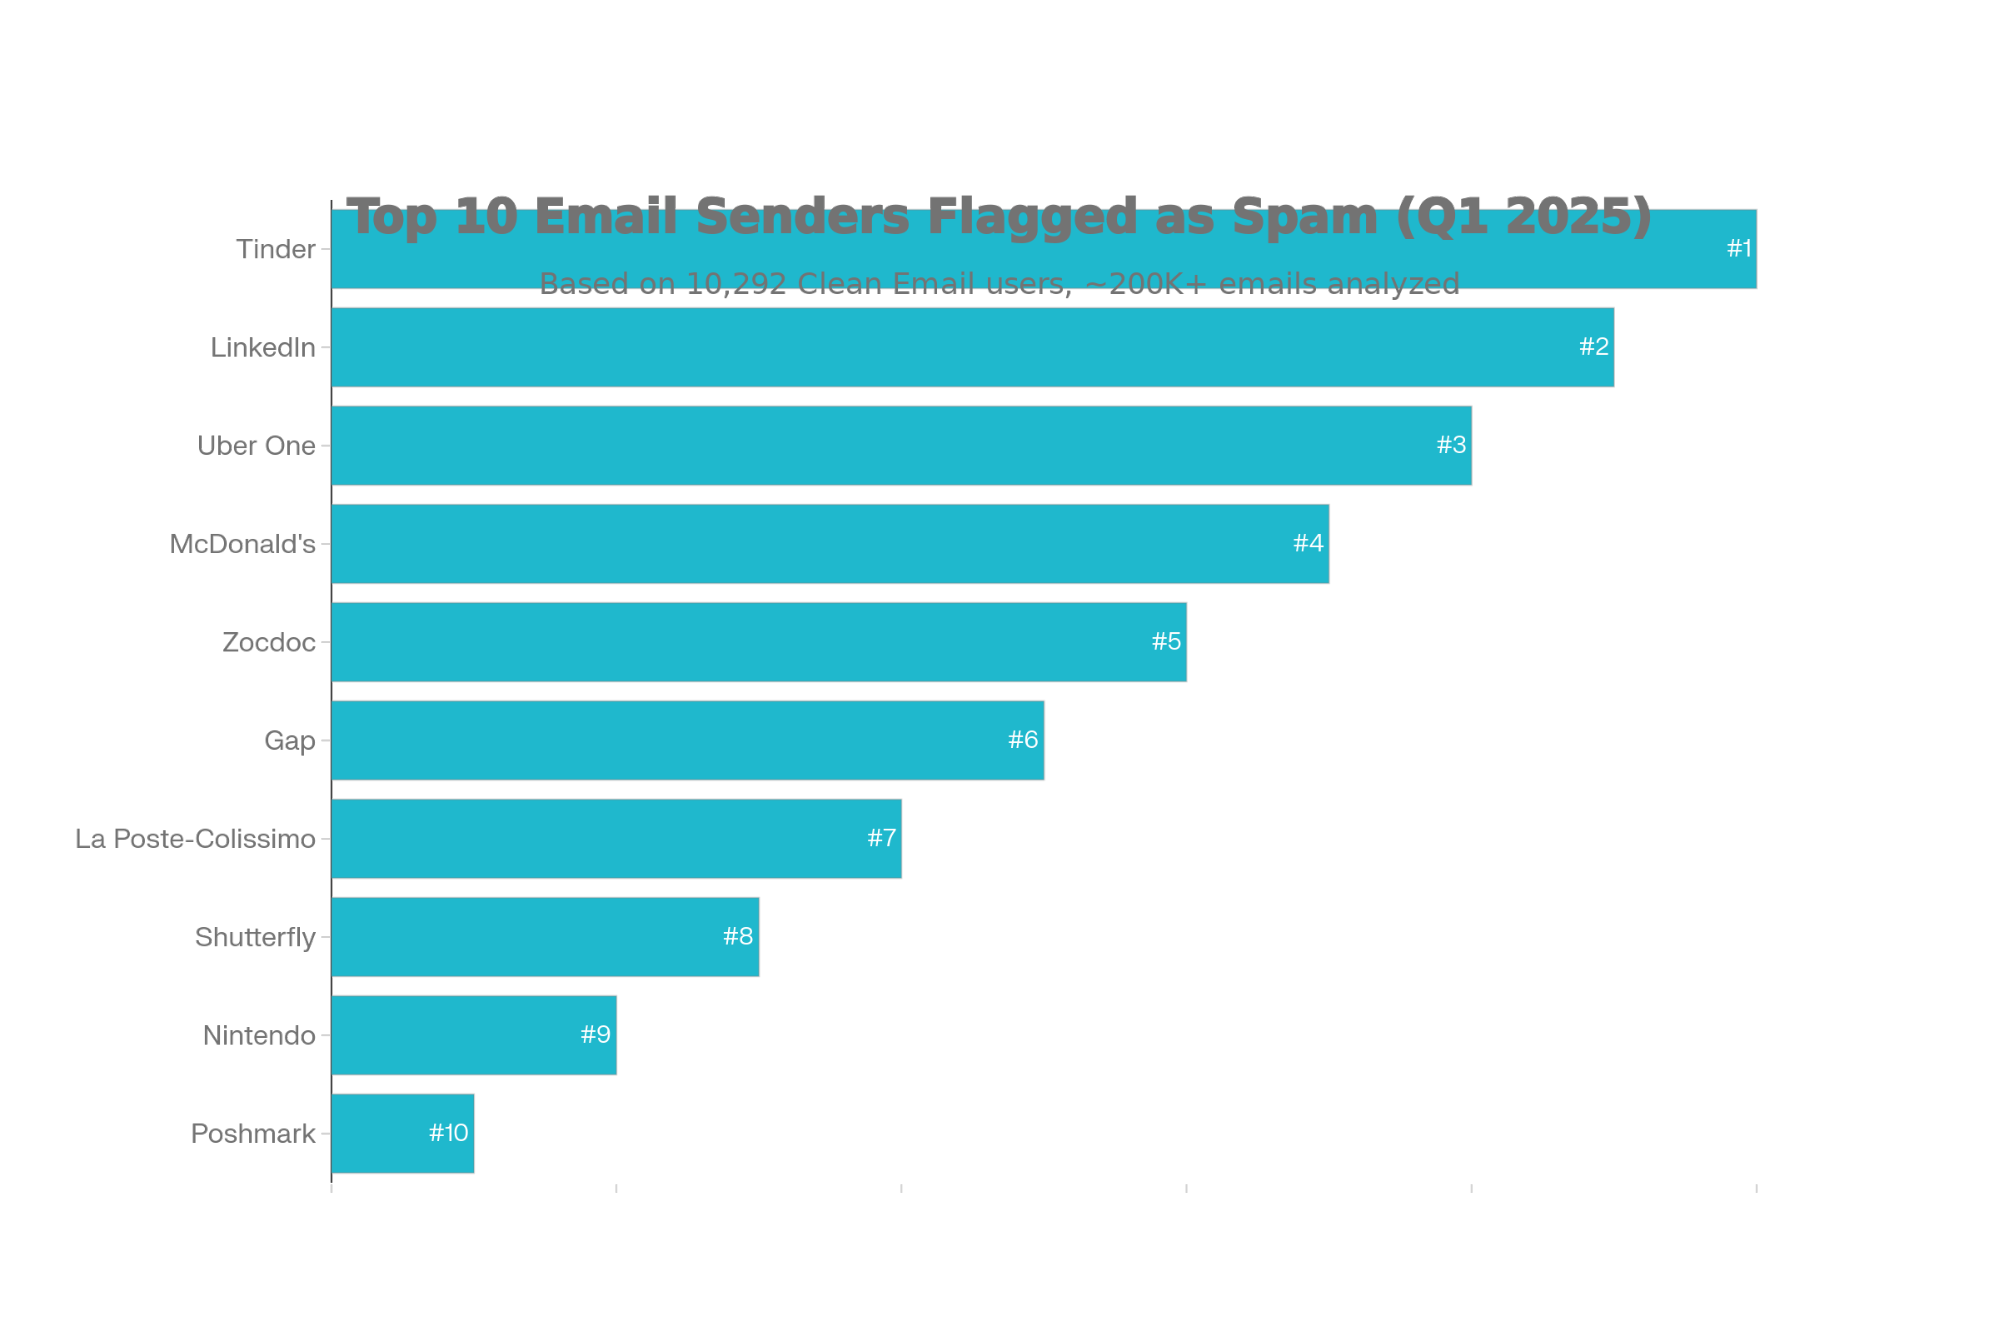
Large-scale platforms with significantly larger user bases appeared substantially lower in spam-flag frequency, indicating that behavioral tactics—not sender size—drive backlash.
Unsubscribe Hierarchy
Most frequently unsubscribed:
- Professional platforms
- Financial and payment services
- Streaming and SaaS tools
These services were typically retained but volume-reduced, suggesting continued perceived utility.
Behavioral Segmentation
- Spam-first behavior: Non-essential services
- Unsubscribe-first behavior: Essential or account-critical services
- Escalation pattern: Failed unsubscribe → spam flag
6. Dark Patterns & User Retaliation
Clean Email data shows consistent cause-effect relationships:
- Default-on enrollment → higher spam-flag rates
- Multi-step or buried opt-outs → escalation from unsubscribe to spam
- High reminder frequency → indiscriminate junk classification
Regulatory actions (e.g., 2025 FTC enforcement) provide contextual validation but were not used as primary data sources.
7. Technology & Design Trends Shaping 2026
- AI adoption:
- ~85% of organizations using AI in email workflows by end of 2025
- Performance divergence between supervised vs. template-driven AI use
- Interactivity:
- Interactive elements used by ~97% of marketers
- AMP and CSS interactivity approaching baseline expectation
- Design constraints:
- Mobile opens: 54–85%
- Dark mode usage: ~34–56% depending on client
- Accessibility compliance becoming enforceable requirement (EU, 2025)
- Data strategy:
- Shift from inferred tracking to zero-party data collection
- Preference centers and explicit consent replacing behavioral inference
8. Predictions for 2026 (Evidence-Based)
- Spam-flagging of legitimate brands will increase
Supported by 2025 Clean Email behavioral escalation patterns. - Essential vs. non-essential inbox triage will intensify
Supported by unsubscribe vs. spam differentiation. - DMARC enforcement will become de facto mandatory
Supported by provider policy tightening and BIMI dependencies. - AI-generated content quality divergence will affect inbox placement
Supported by saturation trends and algorithmic engagement modeling. - Third-party inbox management adoption will accelerate
Supported by rising inbox load and user coping behavior.
9. Conclusion
A 2025–2026 email industry analysis combining global benchmarks with real-world inbox behavior data shows that email continues to scale in both volume and users while simultaneously facing rising user resistance.
Global email traffic exceeded 376 billion daily messages in 2025 and continues to grow at approximately 4% annually. At the same time, inbox control has consolidated under a small number of providers whose algorithms increasingly determine message visibility.
Original behavioral research from Clean Email’s Q1 2025 study demonstrates a structural shift in inbox dynamics: legitimate brands now account for a greater share of spam-flagging actions than malicious senders. Users exhibit strategic behavior, selectively unsubscribing from essential services while aggressively blocking non-essential communications when opt-out mechanisms fail.
Taken together, the data indicates that email’s future viability depends less on delivery capability and more on sustained user tolerance. By 2026, relevance, authentication, and permission maintenance will function as structural requirements rather than optimization tactics.


