


1. About This Mobile Email Statistics Report
This report is built on the latest available 2024–2026 data from the most trusted and reputable sources in digital communication research—including the Radicati Group, Statista, Microsoft's Work Trend Index, Litmus Email Analytics, ZeroBounce, cloudHQ, Pew Research Center, SurveyMonkey, University of California Irvine, and multiple independent behavioral studies. Where 2026 data is not yet available for specific metrics, the report draws on the most recently published findings and clearly labels data vintage.
Unlike standard benchmark reports that surface headline statistics in isolation, this study goes deeper by combining raw statistics, cross-source validation, behavioral segmentation, and device-specific analysis. Where sources report conflicting figures—a common occurrence in mobile email research due to methodological differences—this report explains the divergence, assesses source quality, and where possible identifies the most defensible estimate.
The report contains a unique forward-looking forecast section covering 2026–2030. These forecasts are not guesses. They are modeled projections built from historical adoption trends, device penetration data, AI adoption rates, hybrid work behavioral shifts, and scenario analysis across three trajectories: conservative, moderate, and aggressive. All assumptions are stated explicitly, and the methodology section discloses source limitations, including vendor bias, regional scope constraints, and measurement challenges created by privacy tools such as Apple Mail Privacy Protection.
Original visuals throughout the report—including trend charts, device suitability maps, cross-device journey flows, notification–productivity diagrams, scenario graphs, and structured data tables—are designed to make complex behavioral patterns immediately accessible. Every statistic in this report is grounded in verifiable, cited data, with transparent notes on source quality and data gaps.
The purpose of this report is singular and specific: to document, analyze, and project how real email users—consumers, professionals, remote workers, and hybrid-office employees—manage their inboxes across mobile, desktop, tablet, and webmail environments. Email marketing performance, campaign open rates, deliverability benchmarks, and marketer-facing metrics are deliberately excluded.

2. Executive Summary
The following findings represent the most important conclusions from this research:
- Mobile is now the default entry point for email. An estimated 54–68% of global email users primarily access their inboxes via smartphone, depending on methodology and survey instrument. Device share of email opens places mobile at 41.6%, webmail at 40.6%, and desktop at just 16.2% as of 2026.
- Desktop email is not dying—it is specializing. While desktop's share of email opens has declined from 34% in 2012 to 16.2% in 2026, desktop remains the preferred environment for composing long replies, conducting bulk cleanup, managing folders, handling attachments, and searching email history.
- Cross-device switching is pervasive. Approximately 65% of users begin an email interaction on mobile and switch to desktop to complete it. A separate measure shows 23% of users who open an email on mobile will reopen that same email on desktop for deeper engagement.
- Email checking frequency is driven by mobile notifications. The average user checks email approximately six times per day on mobile versus three times on desktop. Mobile notifications are one of the primary triggers. Workers receive an average of 275 interruptions per day—from emails, chats, and push notifications—according to Microsoft's 2025 Work Trend Index.
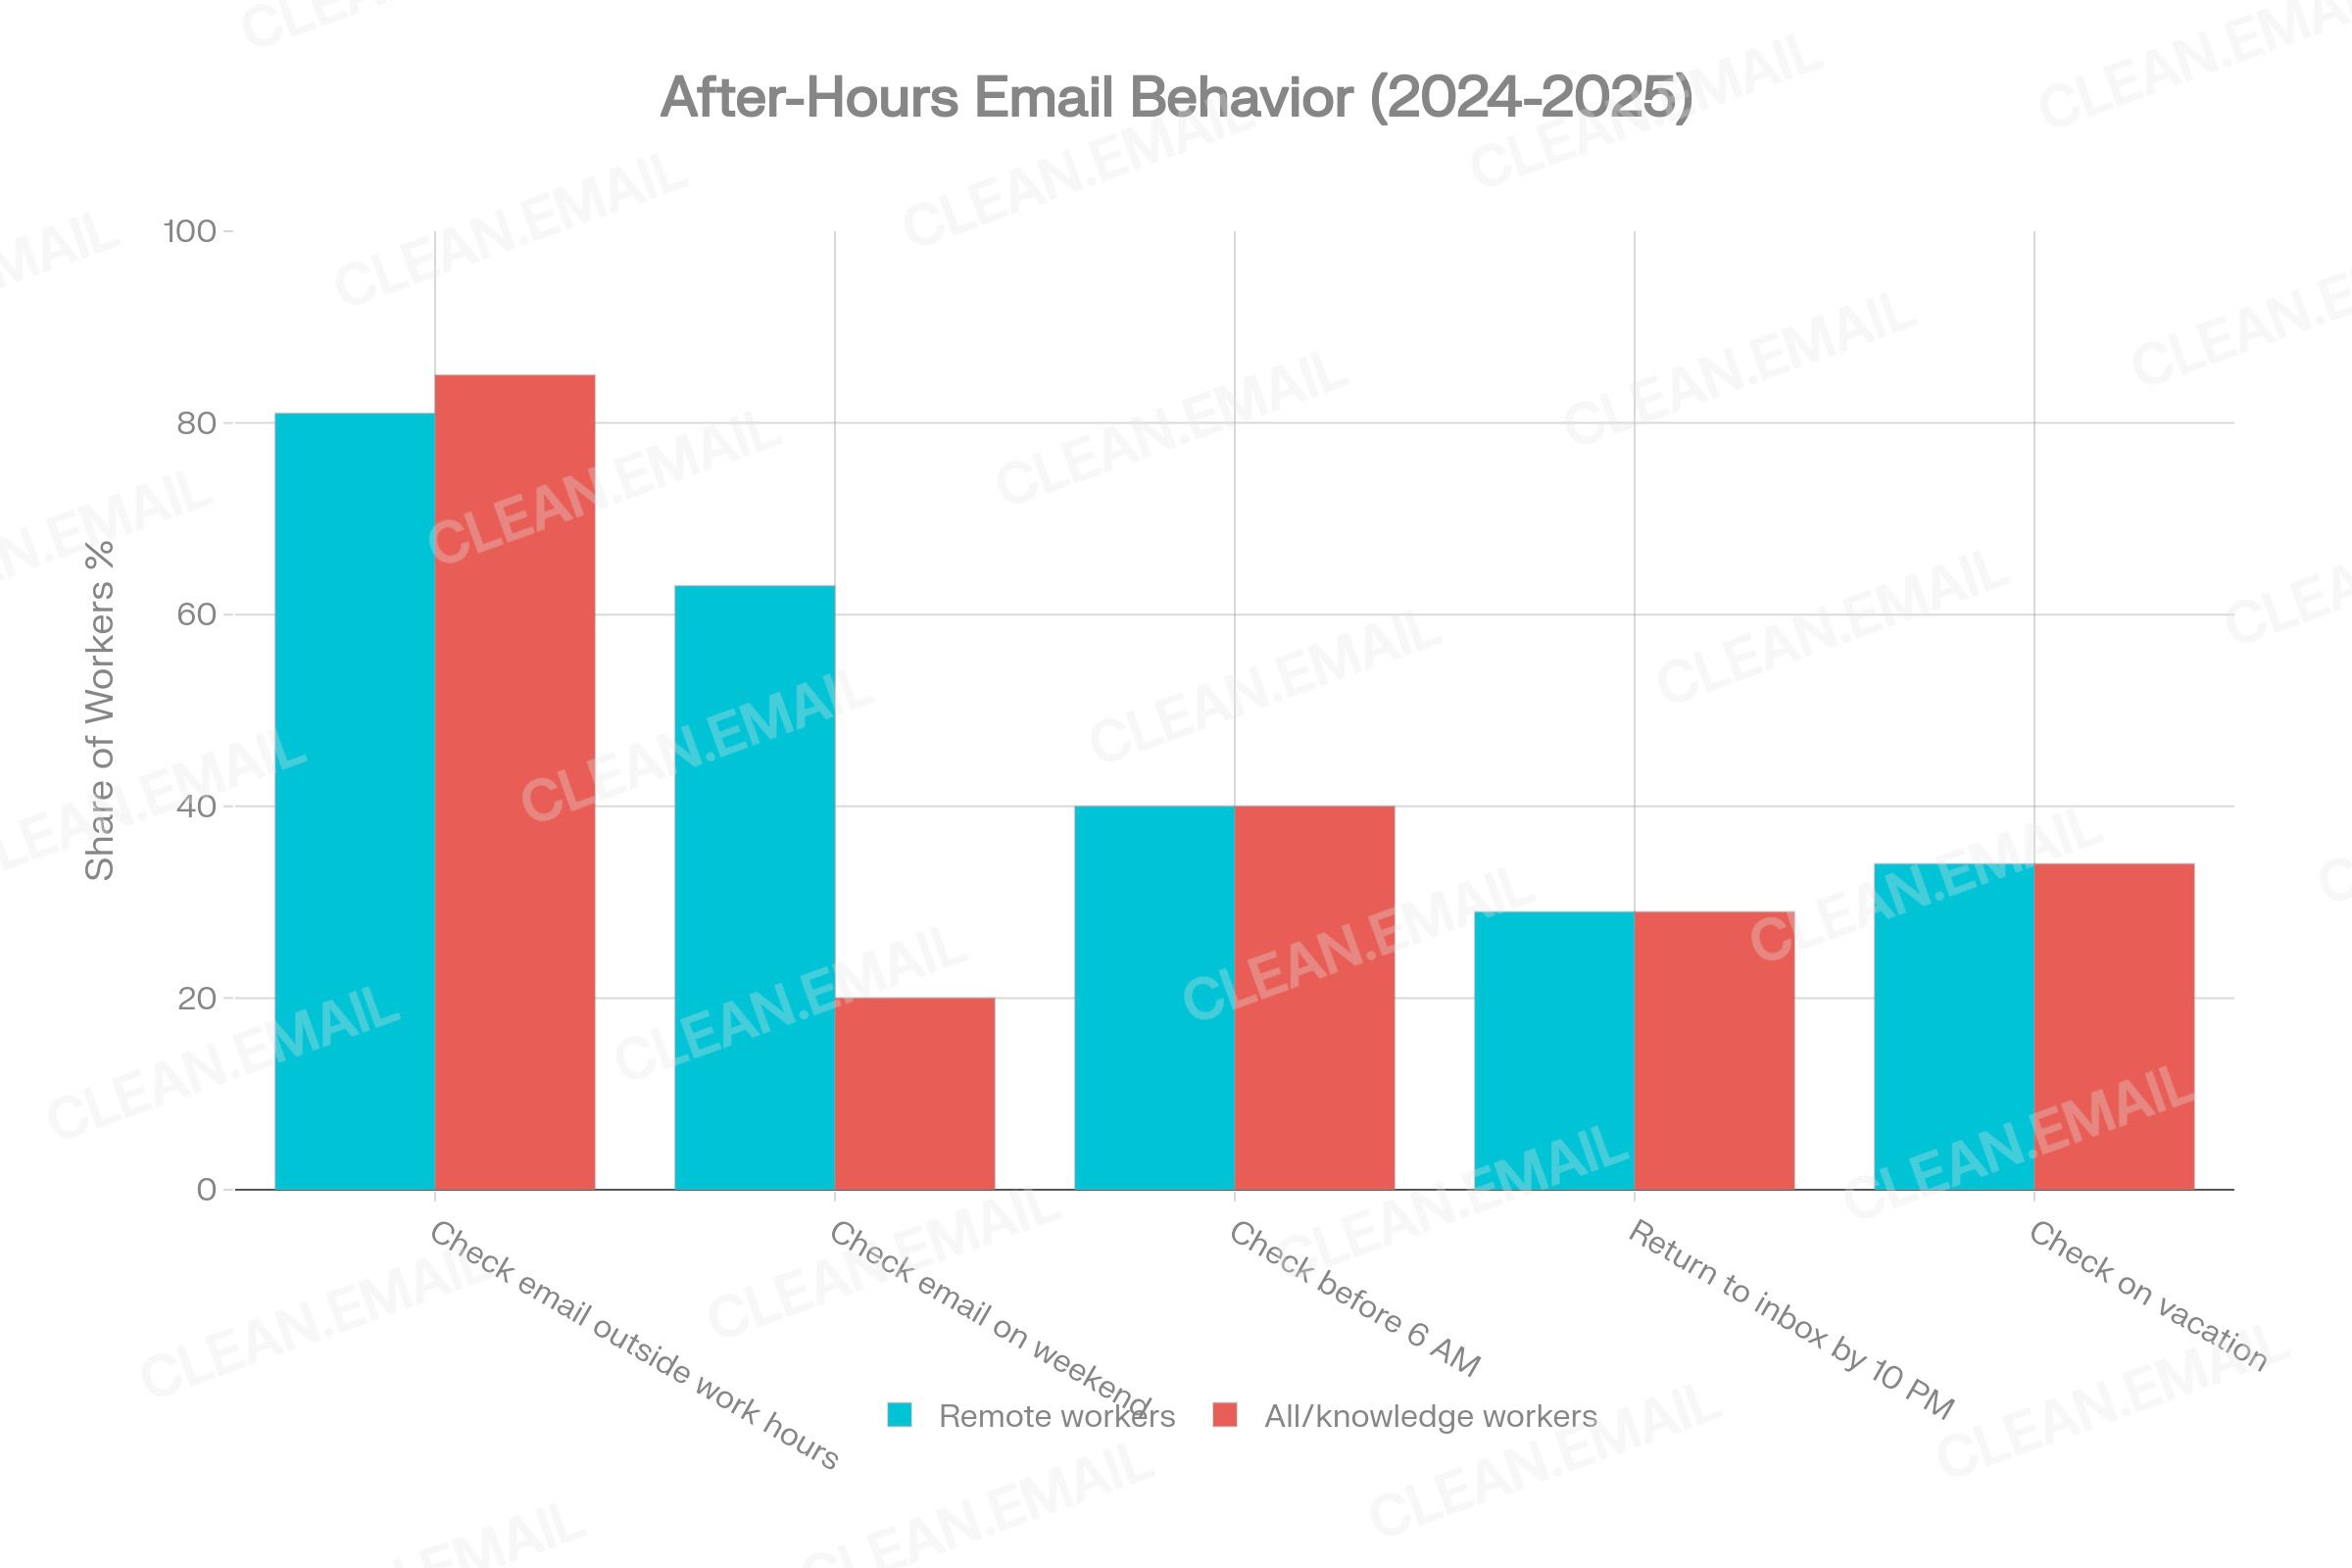
- After-hours email is almost entirely a mobile phenomenon. 40% of employees check work email before 6 AM, and 29% return to their inboxes by 10 PM. 81% of remote workers check email outside standard work hours. The device enabling this boundary erosion is overwhelmingly the smartphone.
- AI-assisted email management is transitioning from early adoption to mainstream infrastructure. As of 2025–2026, 25% of inboxes actively use AI tools to summarize, categorize, or prioritize email. Smart reply and drafting tools are used weekly by more than 40% of business users. The AI email assistant market, valued at $810 million in 2024, is projected to reach $2.38 billion by 2035.
- Generational divergence in device preference is widening. 67% of Gen Z users primarily access email on smartphones, versus only 36% of Baby Boomers. This gap has implications for how email management tools, apps, and notifications will need to evolve through 2030.
3. Key Statistics Table: Mobile & Cross-Device Email (2024–2026)
| Metric | Value | Year | Source | Notes |
|---|---|---|---|---|
| Global email users | 4.7 billion | 2026 (est.) | Statista / EmailTooltester | Projected from 4.48B in 2024 |
| Daily emails sent/received | 392.5 billion | 2026 (est.) | Radicati Group / Statista | CAGR ~4% |
| Mobile share of email opens (client) | 41.6% | 2026 | Litmus / AuroraSendCloud | Measure of client-tracked opens |
| Webmail share of email opens | 40.6% | 2026 | Litmus / AuroraSendCloud | Gmail dominates at 86.3% of webmail |
| Desktop share of email opens | 16.2% | 2026 | Litmus / AuroraSendCloud | Down from 34% in 2012 |
| iPhone share of mobile email opens | 90.5% | 2026 | Litmus / AuroraSendCloud | Android 4.9%, iPad 3.0% |
| % users primarily check email on mobile | 54–68% | 2025–2026 | Multiple (ZeroBounce, Emailsorters) | Range reflects methodological variation |
| Gen Z mobile email preference | 67% | 2025 | Campaign Monitor / EmailTooltester | Smartphone as primary device |
| Millennial mobile email preference | 59% | 2025 | EmailTooltester | Declining desktop use |
| Baby Boomer desktop preference | 29% | 2025 | EmailTooltester | Highest desktop usage by age group |
| Daily email checking frequency (mobile) | ~6x/day | 2025 | Emailsorters | vs. ~3x/day on desktop |
| % users checking email every day | 93% | 2026 | ZeroBounce | 6% exempt on vacation |
| % check email first thing in morning | 58% | 2024–2025 | Multiple (OptinMonster, ZeroBounce) | Strongly mobile-driven |
| % checking 3–5 times/day | 42% | 2026 | ZeroBounce | Largest single frequency bucket |
| % checking 10–20+ times/day | 49% | 2025 | OptinMonster | Combined |
| Office workers' daily received emails | 121 | 2024–2025 | Radicati Group / cloudHQ | Business users |
| Time spent on email per week (office) | 5–15.5 hours | 2024 | Clean Email / McKinsey | Variable by role |
| % employees checking email before 6 AM | 40% | 2025 | Microsoft Work Trend Index | 31K workers, 31 countries |
| % employees returning to inbox by 10 PM | 29% | 2025 | Microsoft Work Trend Index | "Triple peak" workday pattern |
| % remote workers checking email off-hours | 81% | 2025–2026 | WorkTime | Remote-specific figure |
| Daily interruptions from digital notifications | 275/day | 2025 | Microsoft Work Trend Index | Email + chat + calls combined |
| Time to regain focus after interruption | ~23 min | Academic | UC Irvine research | Established cognitive science finding |
| % users switching device to complete email | 65% | 2024–2025 | EmailMonday / Genesys | Start mobile, complete on desktop |
| % reopening email on desktop after mobile open | 23% | 2024 | Adobe / OptinMonster | Cross-device re-engagement rate |
| % replying faster on mobile | 82% | 2025 | Emailsorters | But only 37% prefer composing detailed replies on mobile |
| AI-managed inboxes (% of total) | 25% (2025–2026) | 2025–2026 | cloudHQ | Projected 50% by 2030 |
| AI assistant market size | $810M (2024) → $2.38B (2035) | 2024 | Market Research Future | CAGR 10.4% |
| Mobile email market size | $12.17B (2023) → $30.40B (2030) | 2025 | P Market Research | CAGR ~13.9% |
| % employees receiving work comms outside hours | 85% | 2025 | SurveyMonkey | At least a few times/month |
| % workers responding off-hours regularly | 58% | 2025 | SurveyMonkey | At least a few times/week |
4. Methodology and Source Quality Notes
Data Collection Approach
This report draws on three categories of data: (1) primary research surveys conducted by credible organizations, (2) behavioral analytics derived from email client tracking platforms, and (3) market sizing and forecast models from specialist research firms.
Key Source Notes and Limitations
Litmus Email Analytics tracks email client opens across millions of tracked campaigns. The device breakdown (41.6% mobile, 40.6% webmail, 16.2% desktop) reflects client-tracked opens in marketer-side campaigns, not total inbox behavior. However, it is the most consistently measured long-term data series for device-level email opens.
Apple Mail Privacy Protection (MPP), introduced in 2021, pre-fetches email pixels automatically, inflating open rate measurements. Litmus's data has been affected: Apple's share of "opens" is partially driven by machine-processed opens, not human reads. This makes the 49.79% Apple share in March 2025 a methodologically complex figure.
Survey data (ZeroBounce, Emailsorters, OptinMonster) is based on self-reported behavior. The ZeroBounce 2026 report surveyed 1,091 adults across four continents (US, Canada, Australia, India, Israel, Europe), aged 18–65, all fully employed. Emailsorters surveyed a narrower sample with less disclosed methodology. These figures should be treated as directional behavioral indicators, not population-level measurements.
Microsoft Work Trend Index (2025) analyzed trillions of Microsoft 365 productivity signals and surveyed 31,000 knowledge workers across 31 countries. This is one of the most robust behavioral datasets on email habits at work, but it over-represents Microsoft 365 users and knowledge workers, and may not reflect SMB or developing-market behavior.
cloudHQ Email Statistics Report 2025–2030 is based on behavioral analysis of 12.8 million email accounts, survey data from 45,000 global users, and cross-referenced government/industry data. CloudHQ is a Google Workspace partner; some projections may reflect usage patterns skewed toward Gmail-heavy populations.
Radicati Group is a primary source for global email volume and user count projections. The 2024–2028 report is behind a paywall; the executive summary is publicly available and widely cited.
Historical device trend data from Return Path (2012–2017), Litmus (2018–2022), and AuroraSendCloud (2026) uses different base methodologies. Apparent "declines" in mobile share (from 72% in 2022 to 41.6% in 2026) are partly explained by methodological shifts, not genuine declines in mobile email behavior. The numbers across years are not perfectly comparable.
5. Contextual Overview: The Email Ecosystem in 2026
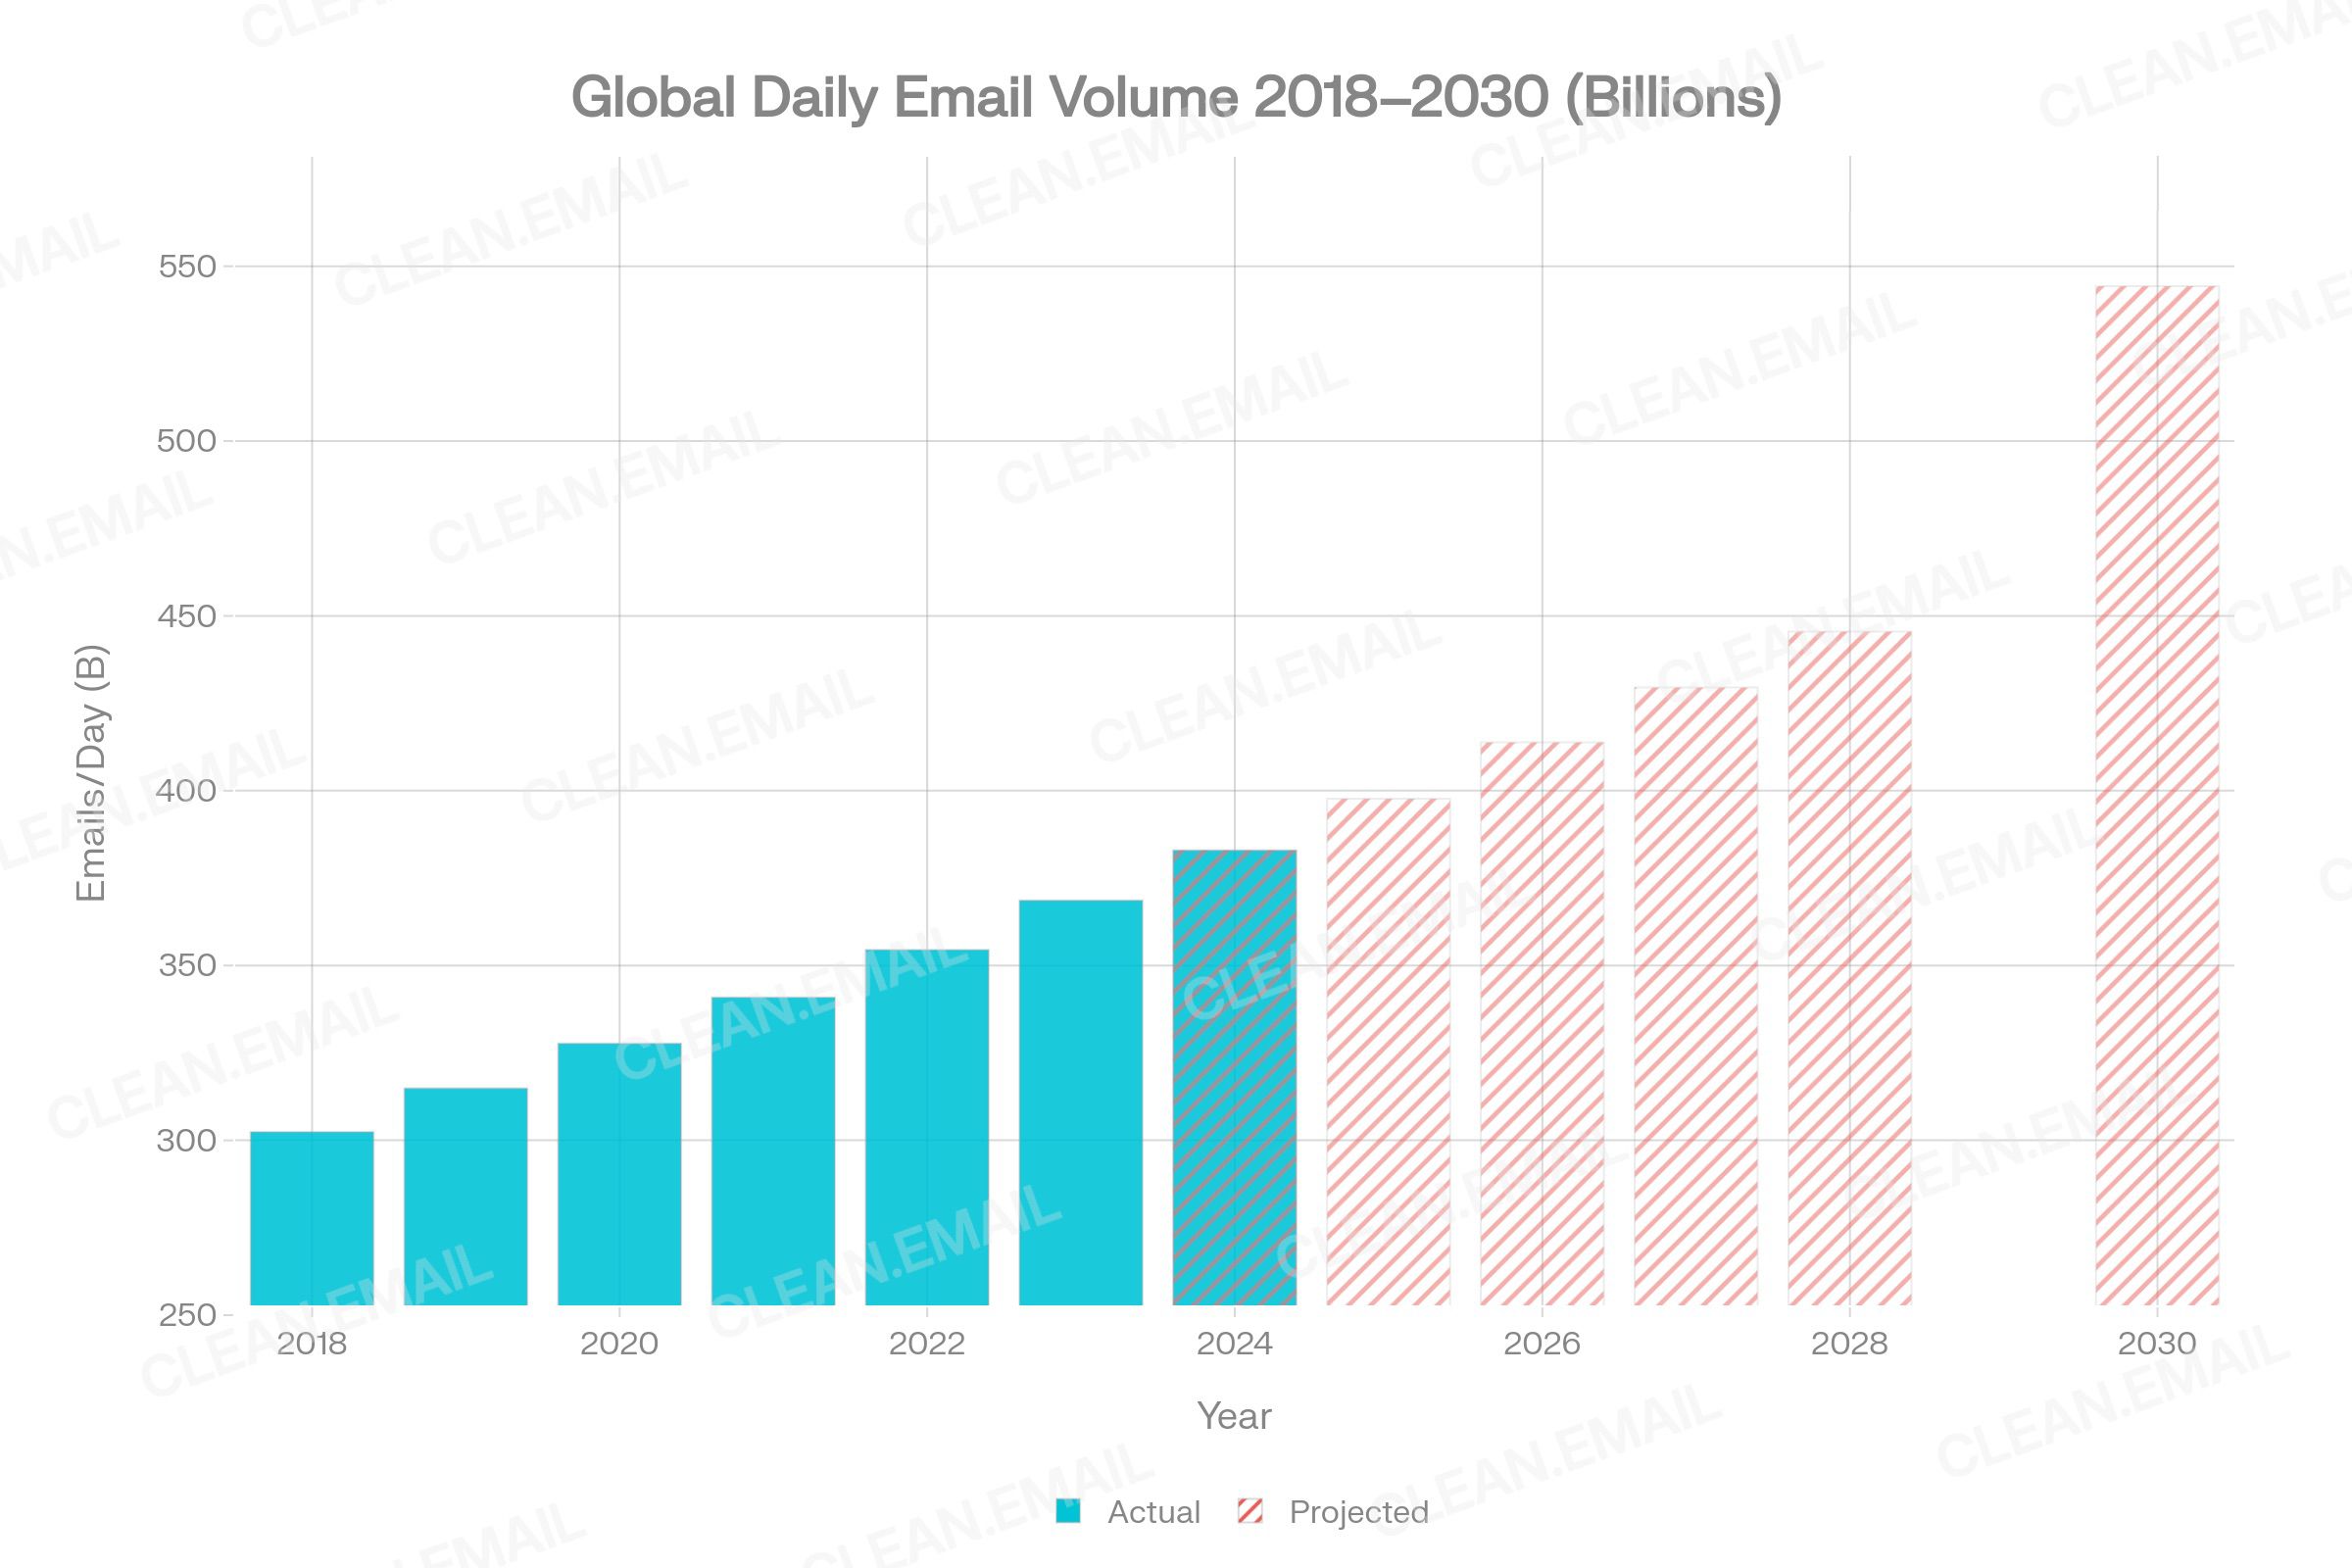
Email remains the world's most universal digital communication layer. By 2026, an estimated 5.02 billion people globally use email—representing over 60% of the world's population and approximately 83% of active internet users. Daily global email traffic is projected to reach 392.5 billion messages in 2026, up from 361.6 billion in 2024. The volume figures include both human-written email and a rapidly growing segment of automated, transactional, and AI-generated email.
By 2026, system-generated and AI-triggered emails account for an estimated 38% of total email traffic. The human-to-human and human-to-business email layer—which is the primary subject of this report—is growing more slowly but continues to expand alongside digital population growth.
For context: the average office worker receives 121 emails per day and sends approximately 40. Across a 45-year career, professionals will spend an estimated 2,970 workdays managing email. This scale makes device behavior—how, when, and where that management occurs—a consequential subject for personal productivity, organizational efficiency, and digital wellbeing.
6. Detailed Analysis: Mobile Email Usage
6.1 Scale and Penetration
Mobile email access is now functionally universal in markets with high smartphone penetration. Approximately 91% of US adults own a smartphone as of 2025, up from just 35% in 2011. The Pew Research Center's Mobile Fact Sheet confirms 98% of Americans own a cellphone of any kind.
Among email users globally, multiple studies converge on 54–68% primarily accessing email via mobile devices:
- 54% primarily access email on mobile (smartphone or tablet) — EmailTooltester / Campaign Monitor
- 64% check email primarily on their phones and tablets — ZeroBounce 2026 survey (n=1,091)
- 68% check email primarily via mobile — Emailsorters 2025
- 81% of email users check their inbox on mobile phones — Campaign Monitor (often cited, older methodology)
The range (54–81%) illustrates methodological variation. Surveys asking about "primary device" yield 54–68%; surveys asking about "ever use mobile" or "most commonly used device for any access" reach higher numbers. For this report, the 54–68% range is treated as the defensible primary access figure for 2024–2026.
Among mobile users, 81% prefer smartphones over tablets, with tablets accounting for only 3–9% of mobile email behavior depending on generation. The iPad holds 3.0% of mobile email opens.
6.2 iOS Dominance
The iPhone holds a commanding 90.5% share of mobile email opens globally. Android accounts for only 4.9% of mobile email opens—a dramatic underrepresentation given Android's ~72% global smartphone market share. This disparity has two explanations: (1) iPhone users are more likely to use the native Mail app, which is tracked by analytics platforms, and (2) Android Gmail users are often tracked in the "webmail" or "Gmail app" category separately. Analysts should not interpret this as meaning Android users check email less; it primarily reflects tracking categorization.
Apple Mail (combining iPhone, iPad, and Mac) holds approximately 46.56% of total email client market share as of 2026. Gmail holds 25.45%. Outlook is at 4.38%, primarily representing enterprise desktop and webmail use.
6.3 Timing and Behavioral Patterns
Mobile email use exhibits a clearly non-linear daily pattern, contrasting sharply with desktop behavior:
- Early morning peaks (before 8 AM): 58% of email users check their inbox first thing in the morning. This is almost entirely mobile-driven, as users check phones before getting to a workstation. 40% of employees check work email before 6 AM.
- Commute windows: Mobile users scan inboxes during transit periods. Checking frequency peaks during commutes and lunch breaks.
- Evening peaks: 29% of workers return to their inbox by 10 PM, creating the "triple peak" pattern identified by Microsoft.
- Weekend activity: Mobile opens are disproportionately high on weekends, while webmail and desktop activity concentrates on weekdays. 20% of employees actively work on weekends and check email before noon on Saturday and Sunday.
7. Detailed Analysis: Desktop Email Usage
7.1 Scale and Role
Desktop email's share of tracked opens has declined from 34% in 2012 to 16.2% in 2026—a drop of nearly half over 14 years. Yet this headline obscures a more nuanced reality: desktop email is not disappearing. It is becoming a specialized environment for high-complexity, high-attention email tasks.
68% of employees still prefer checking email on a laptop or desktop, according to a workplace survey cited by The Frank Agency. This figure coexists with the mobile-primary access statistics because many professionals use both: mobile for quick access and triage, desktop for substantive work. The distinction between checking email and managing email is critical.
Desktop email behavior aligns almost entirely with business hours. Engagement peaks during morning work sessions (9–11 AM) and afternoon blocks (1–3 PM). Mobile usage, by contrast, is distributed throughout the entire waking day and into the night.
7.2 Desktop as the Deep Work Environment
Behavioral and survey research consistently identifies desktop as the preferred environment for:
- Writing long, complex replies: Only 37% of users prefer composing detailed replies on mobile, while 82% say they respond faster on mobile for short responses.
- Bulk cleanup: Deleting, archiving, and unsubscribing at scale requires the multi-select, right-click, and keyboard shortcuts available on desktop that are cumbersome or unavailable on mobile touchscreens.
- Searching email history: Advanced search operators (from:, before:, has:attachment) are far more usable on desktop where users can type rapidly.
- Handling attachments: Downloading, reviewing, editing, and responding with attachments requires desktop file system access in most professional workflows.
- Managing folders and filters: Creating inbox rules, setting up automatic filters, and restructuring folder hierarchies are tasks consistently deferred to desktop sessions.
A USC Viterbi School of Engineering study on email response time found that laptop users take almost twice as long to respond as mobile users—but produce longer, more substantive replies. This captures the mobile-speed/desktop-depth tradeoff precisely.
7.3 Desktop Client Landscape
Microsoft Outlook dominates enterprise desktop email, holding approximately 4.38% of total email opens globally but commanding the largest share of enterprise email infrastructure. The email client software market was valued at $5.77 billion in 2024 and is projected to reach $9.9 billion by 2032 at a CAGR of 6.51%.
8. Cross-Device Email Behavior
8.1 Multi-Device Email Reality
The modern email user is not a single-device user. Behavioral data consistently shows that email management is split across devices by task type and time of day, not by preference alone. Key cross-device switching statistics:
- 65% of users start an email interaction on mobile and switch to desktop to complete it.
- 23% of users who open an email on mobile will open it again later on desktop.
- 93% of recipients who open an email on mobile will open it again—often on the same or a different device.
- The typical business email user has access across 2.5 distinct devices, according to Radicati Group projections.
8.2 Device-Switching Triggers
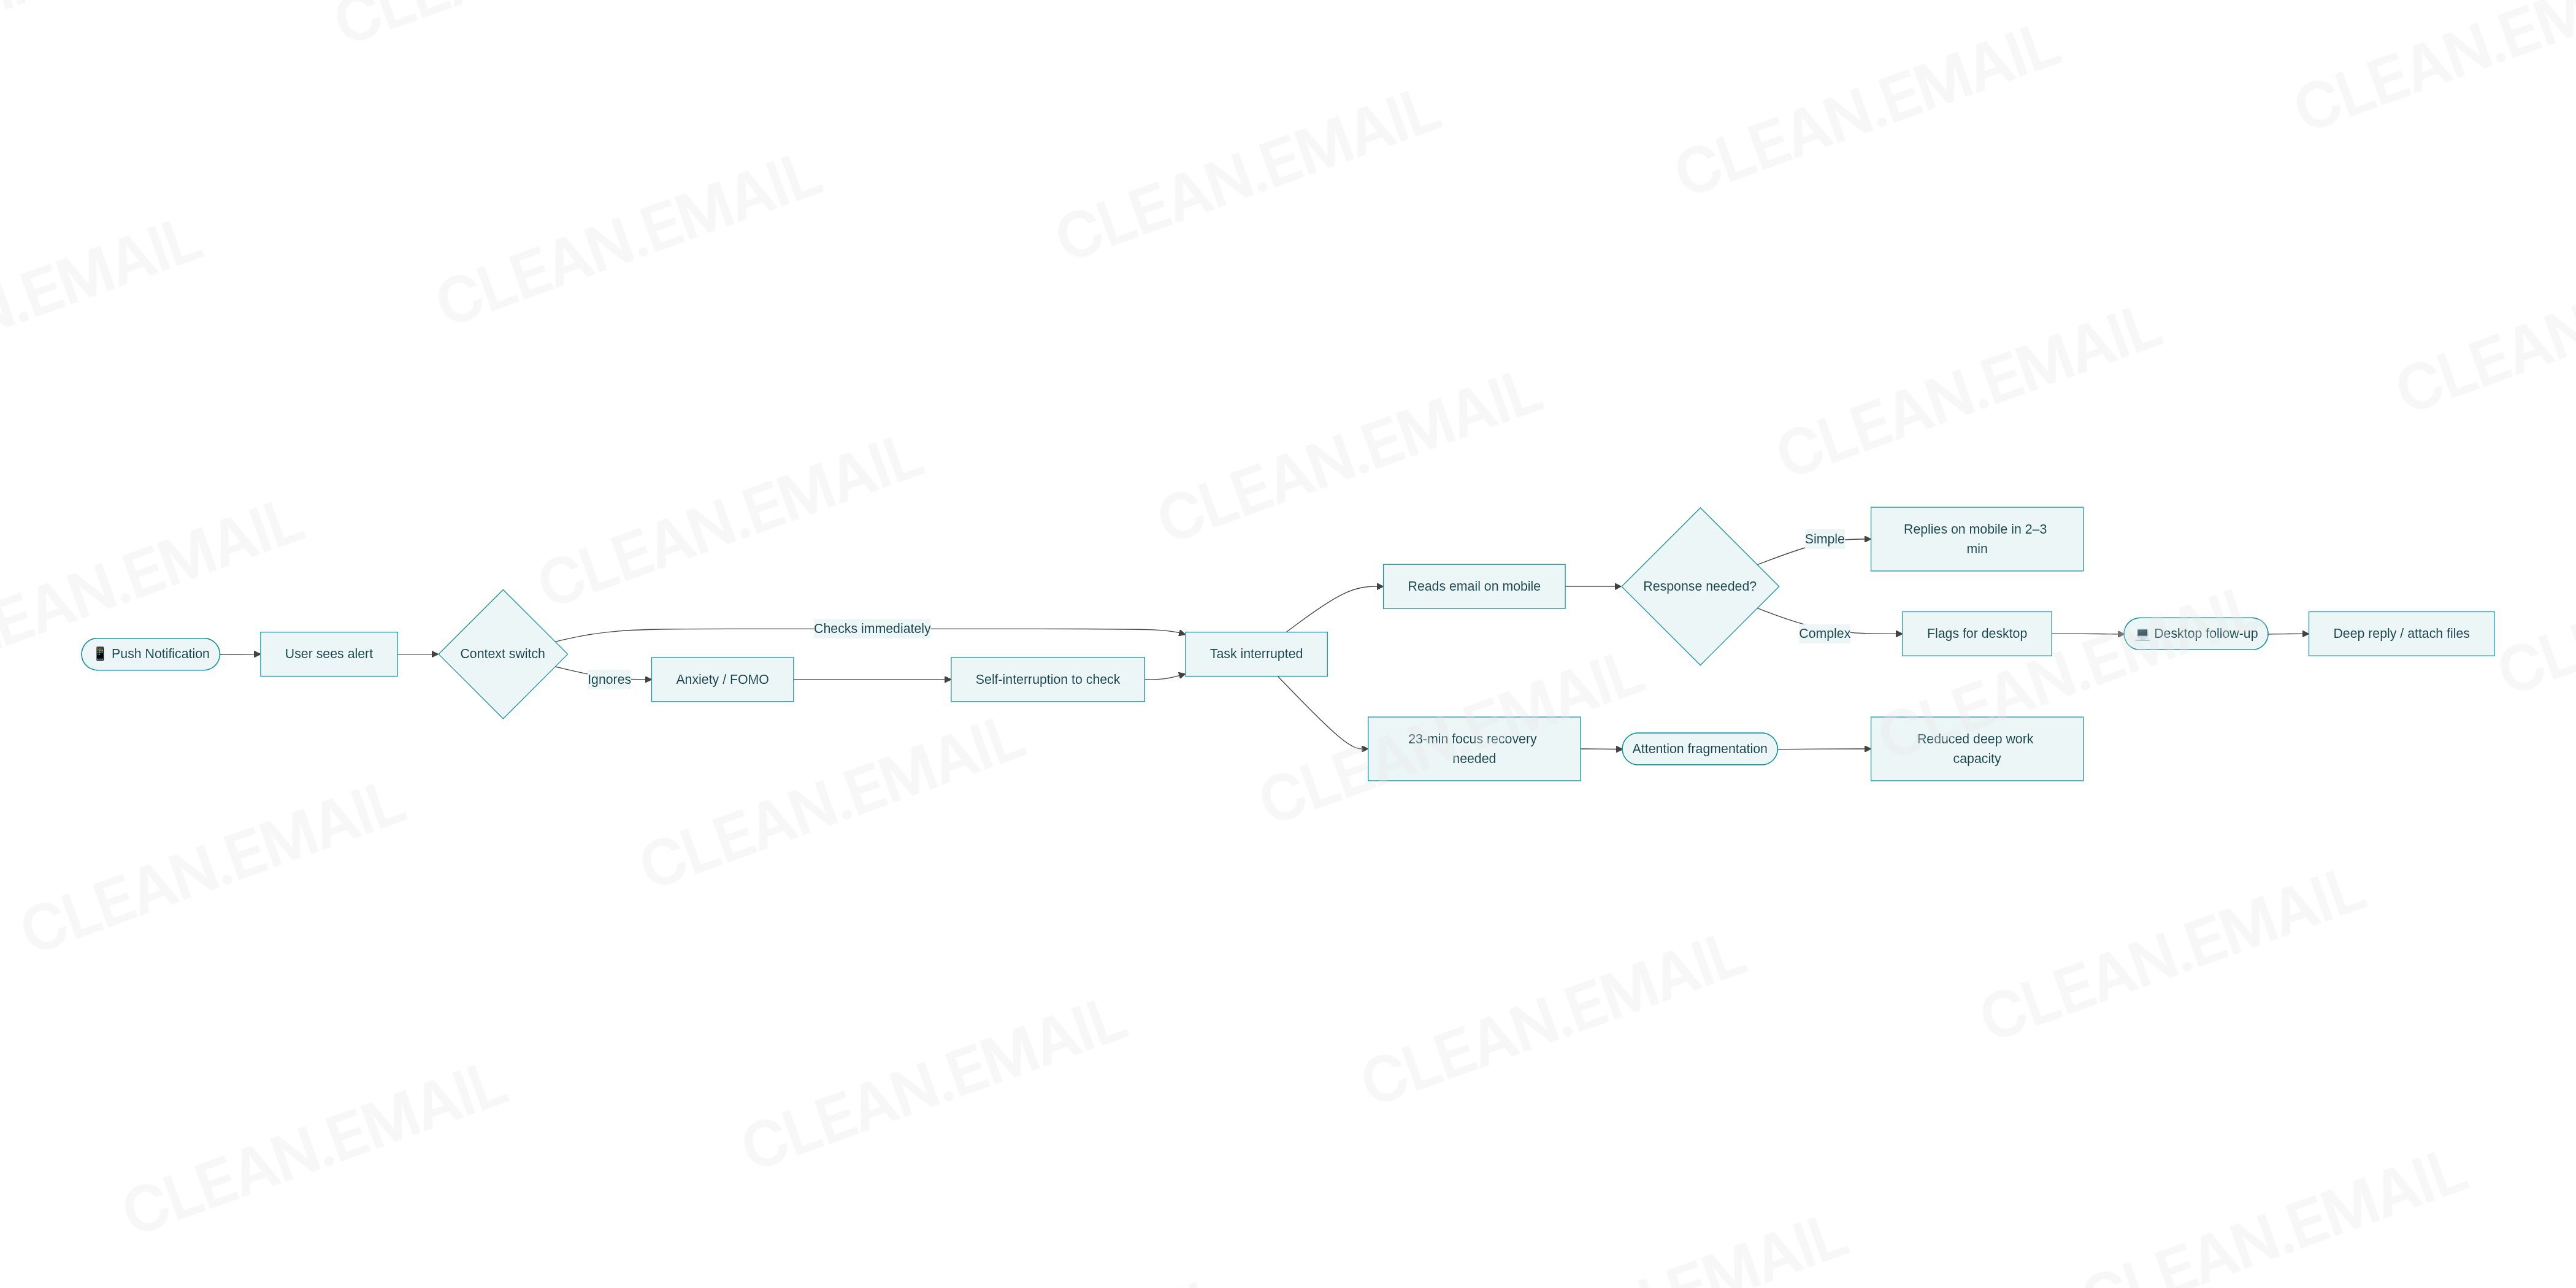
Cross-device switching is not random. It follows predictable behavioral triggers:
- Complexity trigger: Email requires a long response, file attachment, or careful review → switch to desktop.
- Urgency trigger: Notification arrives on mobile → brief read and acknowledge → flag for desktop follow-up.
- Environment trigger: User moves from mobile commute context to desktop work context → natural session handoff.
- Comfort trigger: Fine-grained actions (selecting text, managing folders, precise search) become frustrating on mobile → switch to desktop.
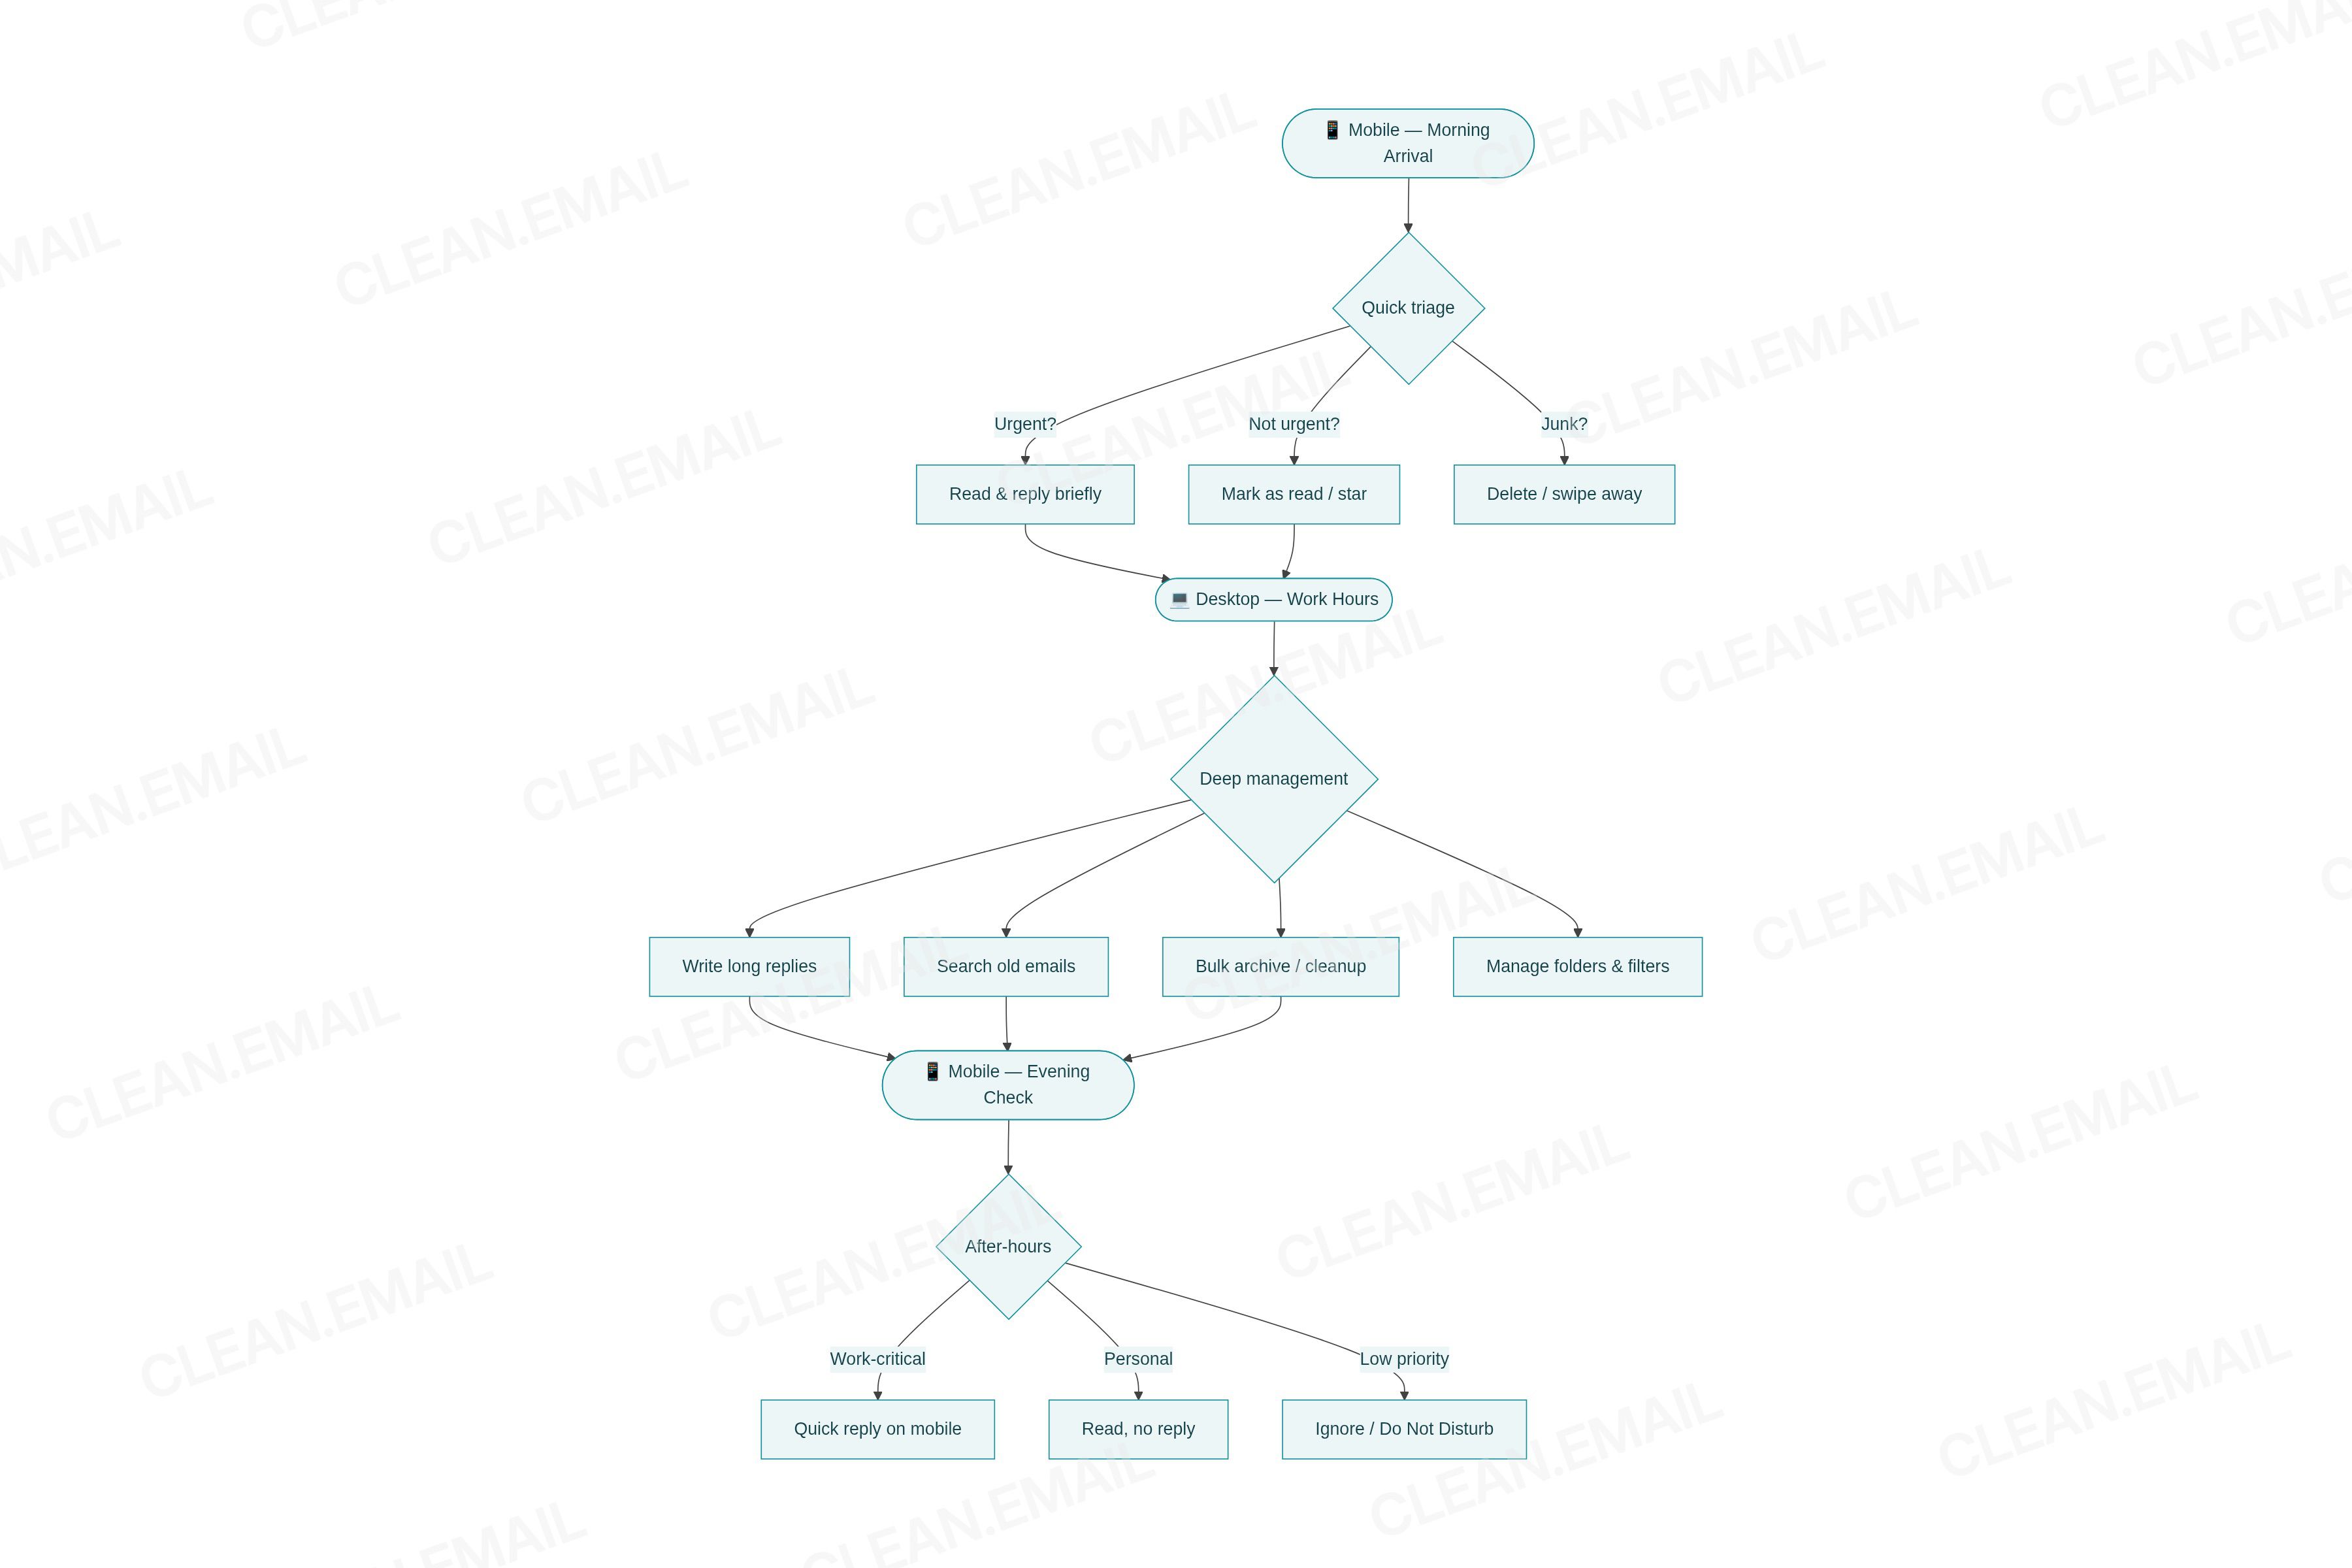
This switching behavior means mobile functions as the attention layer (first awareness, quick triage) and desktop functions as the action layer (meaningful responses, organization, deep work).
9. Email Checking Frequency by Device
9.1 Overall Frequency Data
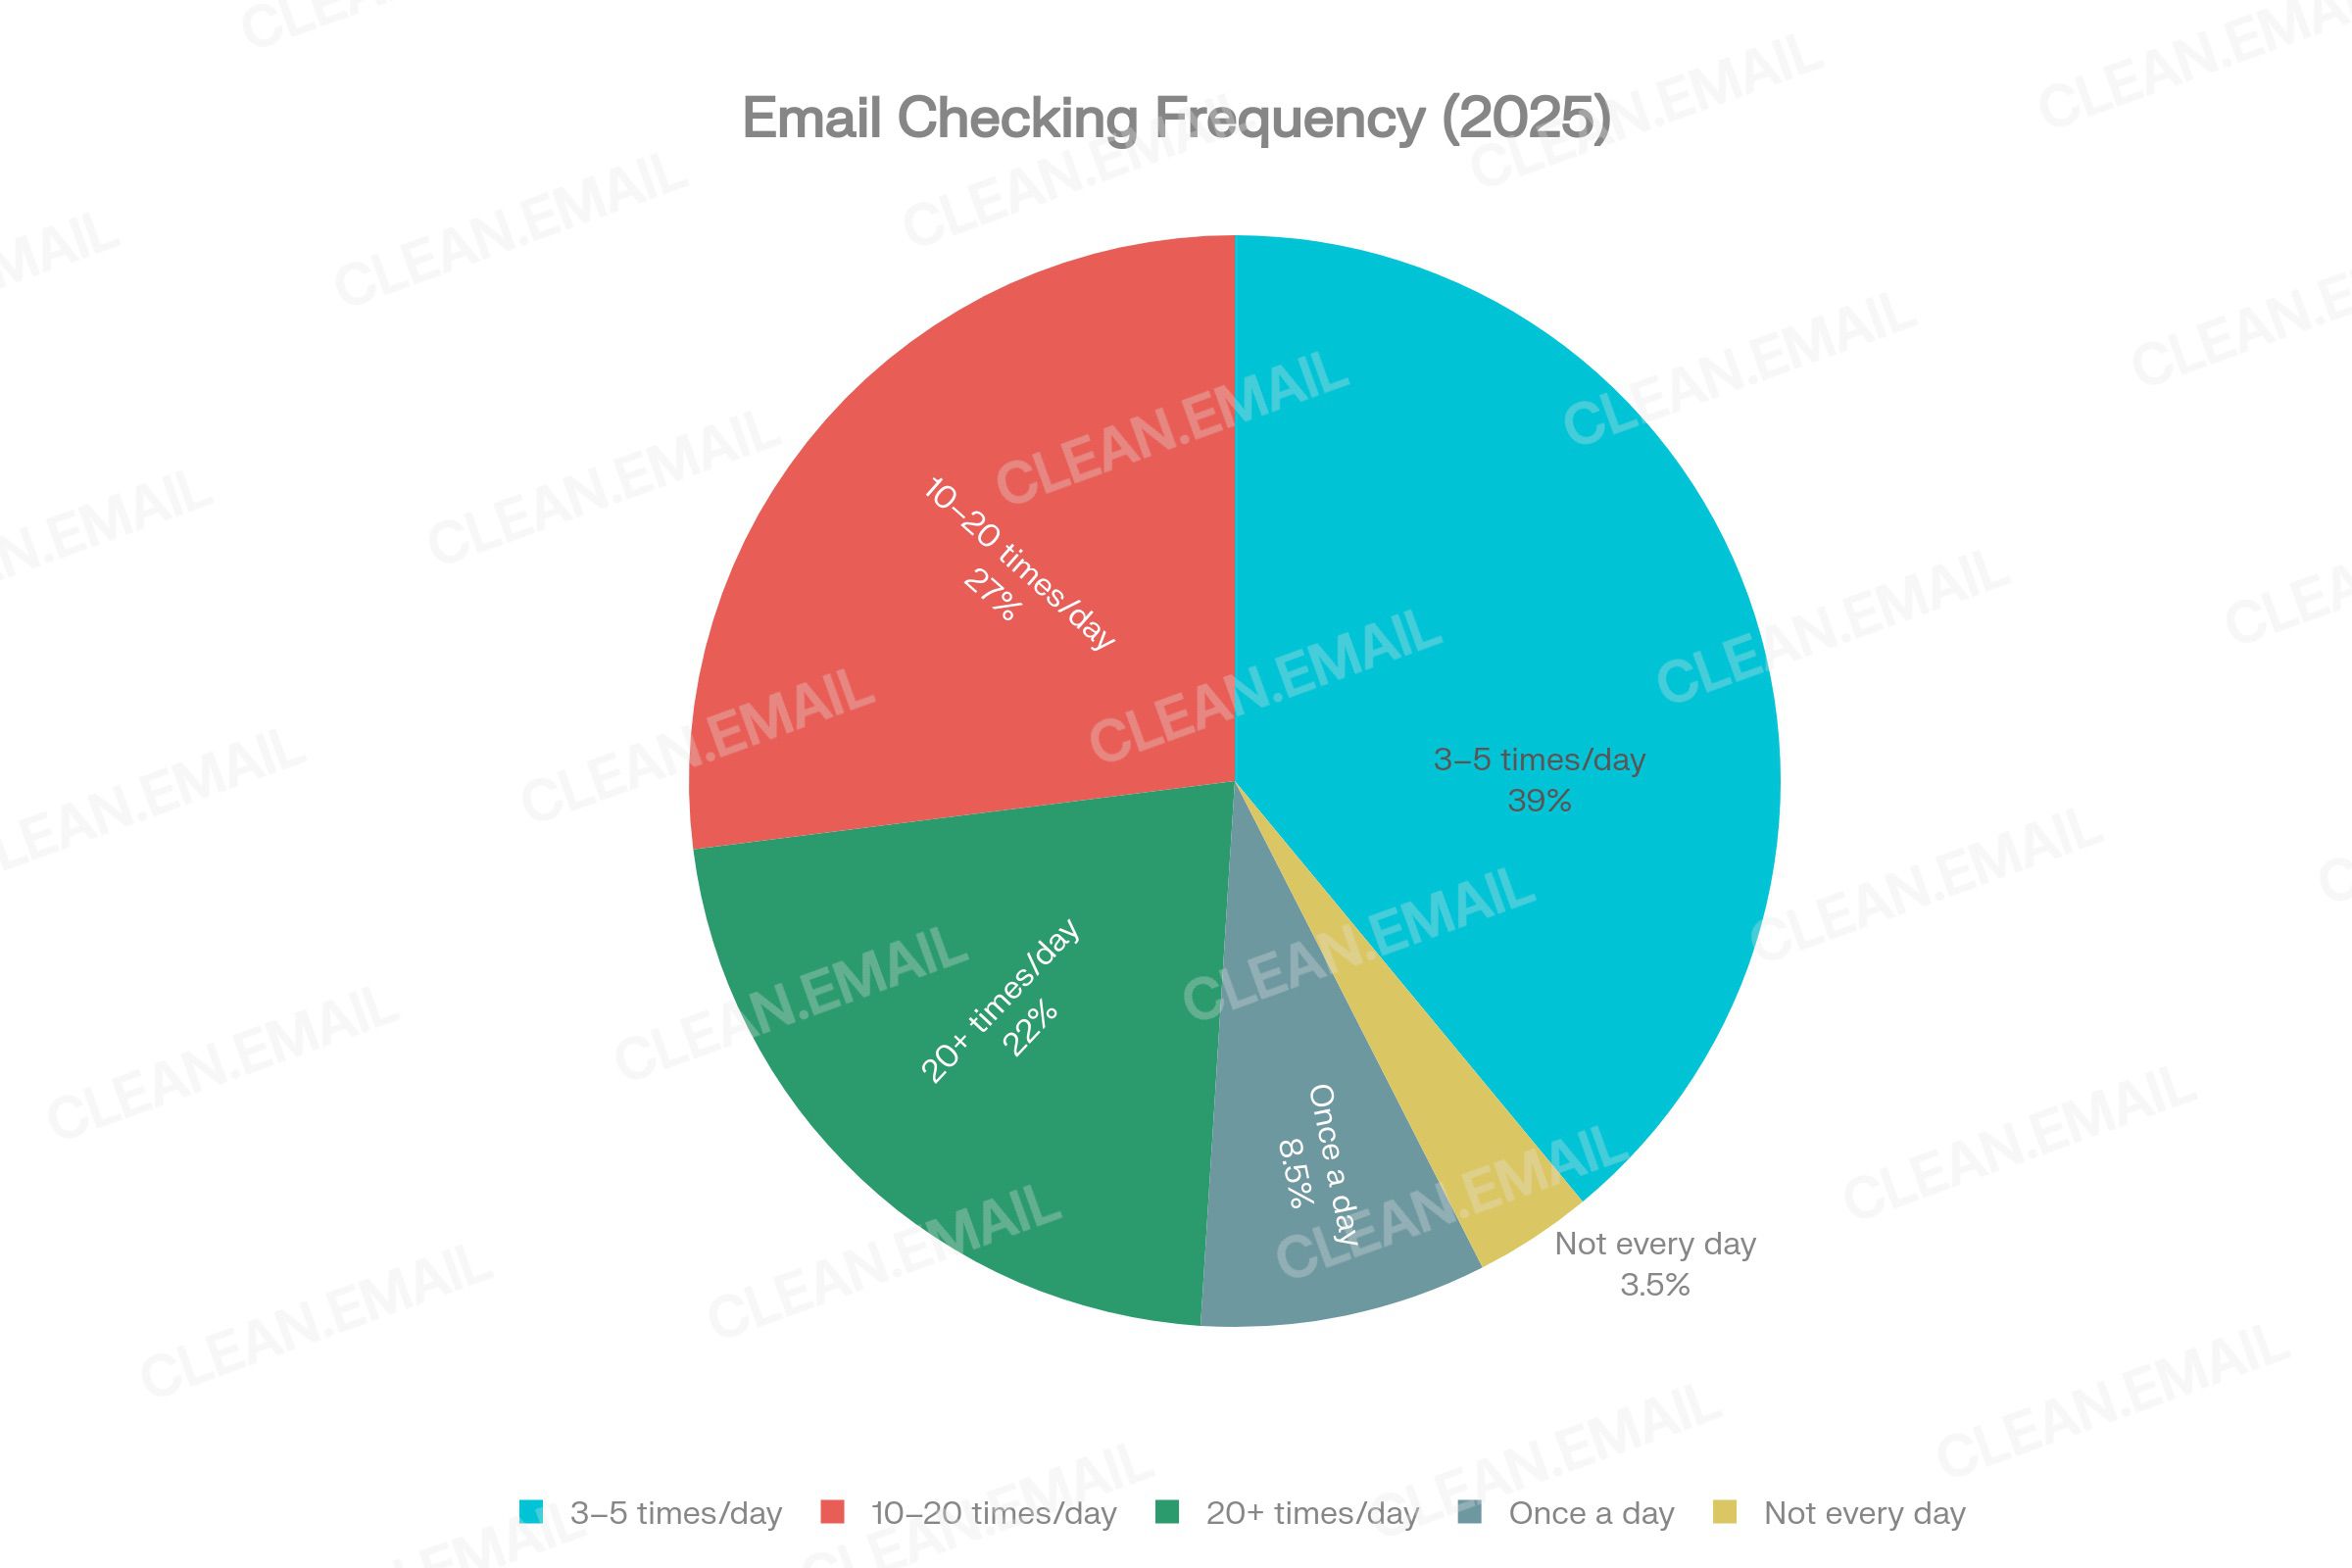
The ZeroBounce 2026 survey of 1,091 adults confirmed that 93% check email every day. The frequency distribution shows:
- 42% check their inbox 3–5 times per day
- 27% check 10–20 times per day
- 22% check more than 20 times per day
- 8.5% check once per day
- 3.5% do not check every day
9.2 Mobile vs Desktop Frequency Differential
Emailsorters' 2025 study found that users open email approximately 6 times per day on mobile versus 3 times per day on desktop—a 2:1 frequency ratio that reflects mobile's role as the ambient, always-available channel.
This frequency gap has a direct relationship with notification behavior. The average US smartphone user receives 46 app push notifications per day. Email notifications represent a significant portion of these. Every notification creates a potential micro-session on mobile—a brief 1–3 minute check that adds to mobile's cumulative session count but rarely results in deep inbox management.
9.3 When Users Check Email
The day-of-week and time-of-day patterns for email checking reveal important device behavior differences:
- Desktop email activity concentrates strongly on weekdays, peaks Tuesday–Thursday, and drops sharply on weekends.
- Mobile email activity is distributed throughout the week, with higher proportional usage on weekends and outside of office hours.
- Email sent in the morning tends to receive longer, more thoughtful replies—consistent with desktop being the reply medium during morning work sessions.
- Emails sent in the afternoon or on weekends receive shorter replies—consistent with mobile being the reply device in those time windows.
10. Email Management Actions by Device
10.1 Mobile-Native Actions
Certain email management behaviors are predominantly performed on mobile devices:
| Action | Primary Device | Behavioral Evidence |
|---|---|---|
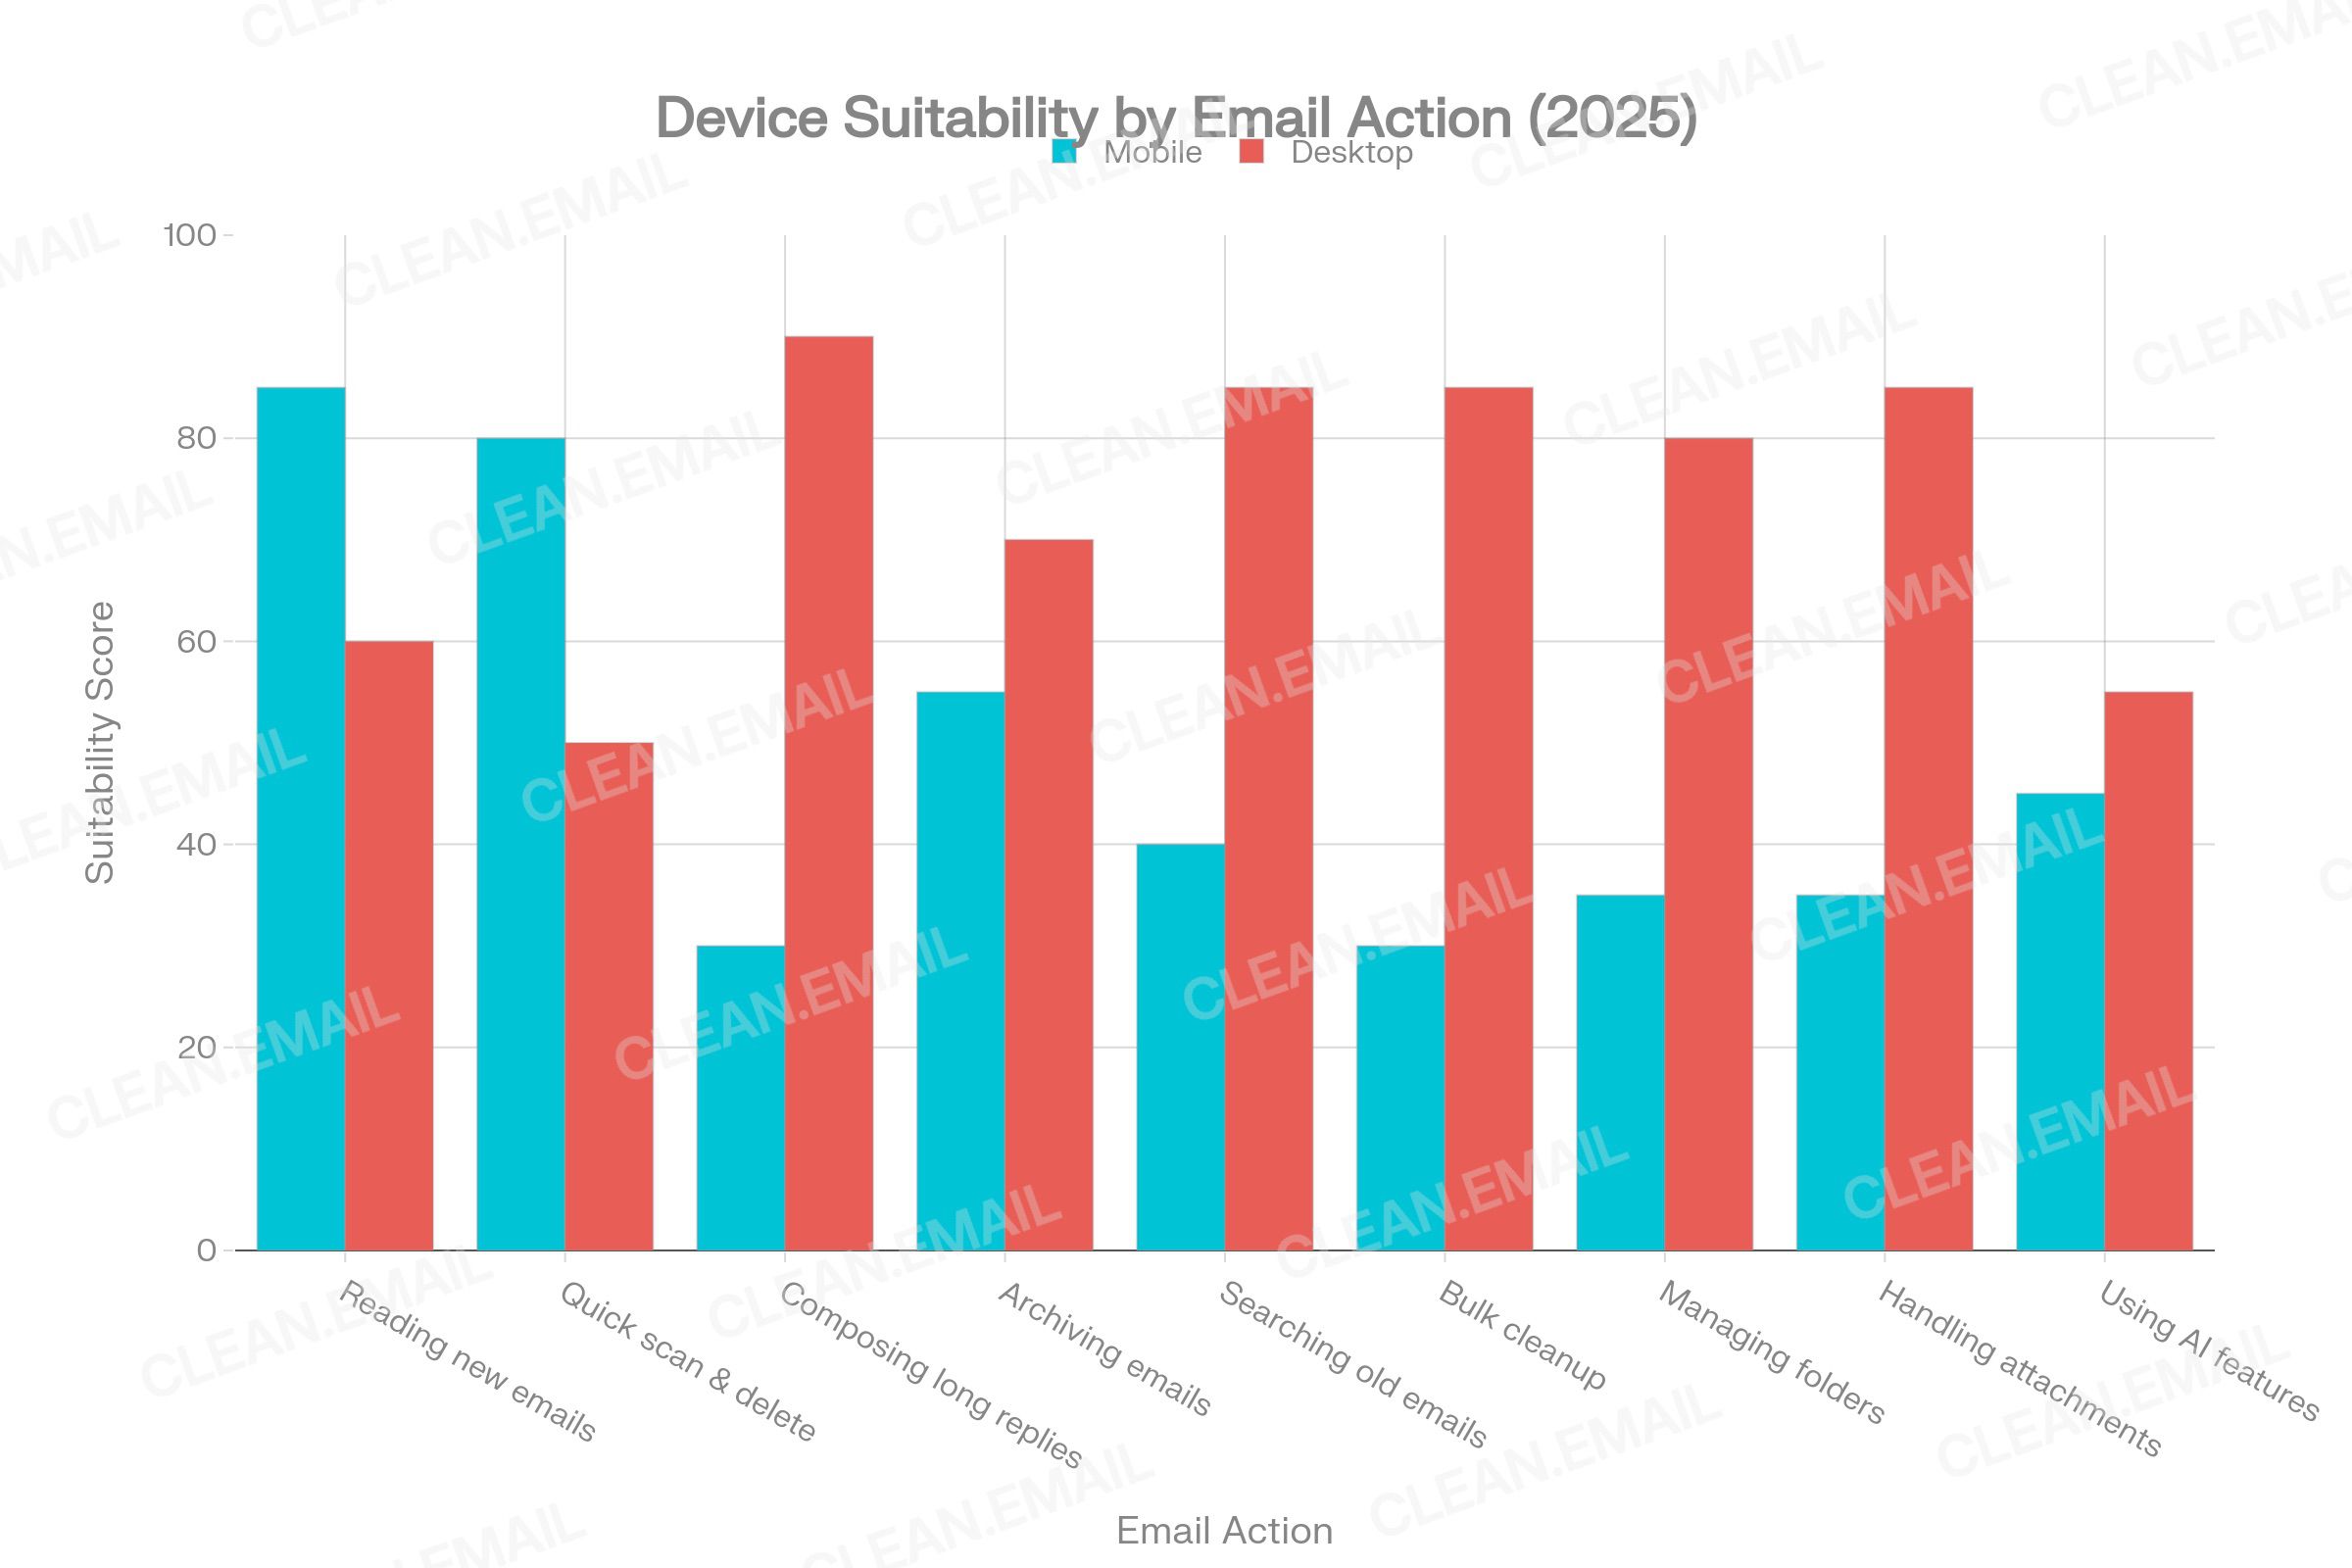
| Reading new emails | Mobile | 85% mobile suitability score; 6x/day mobile check rate |
| Quick scan and triage | Mobile | Swipe gestures, badge counts, notification previews |
| Deleting obvious spam/junk | Mobile | Swipe-to-delete, bulk press-hold on iOS/Android |
| Brief replies (under 100 words) | Mobile | 82% of users reply faster on mobile |
| Checking for urgent messages | Mobile | Push notifications drive immediate checks |
10.2 Desktop-Native Actions
Conversely, these actions show strong desktop preference:
| Action | Primary Device | Behavioral Evidence |
|---|---|---|
| Writing long replies (200+ words) | Desktop | 90% desktop suitability; USC email length research |
| Searching old emails | Desktop | Advanced search operators; keyboard typing speed |
| Bulk archiving/deleting | Desktop | Multi-select, keyboard shortcuts, larger view |
| Managing folders and labels | Desktop | Complex UI elements; drag-and-drop |
| Handling attachments | Desktop | File system access; desktop apps |
| Unsubscribing from lists | Desktop | Requires deliberate action; better browser support |
| Setting up email filters/rules | Desktop | Complex configuration; best in web or native clients |
10.3 The Inbox Zero Gap
On mobile, users are more likely to scan, delete, or archive emails reactively—responding to individual notifications. On desktop, they are more likely to engage in systematic inbox management: batch processing, applying filters, bulk-selecting and archiving old threads, and conducting deliberate cleanup sessions. This behavioral split means mobile creates more frequent but shallower inbox engagement, while desktop sessions are rarer but more organizationally impactful.
11. Work vs Personal Email Usage by Device
11.1 Separation Patterns
Most professional email users maintain at least two email accounts—86% of ZeroBounce respondents had at least three email addresses. The use of multiple accounts creates a natural device-based separation in some user segments:
- Work email tends to be accessed via managed corporate apps (Outlook, Google Workspace) on both desktop and mobile.
- Personal email is accessed more fluidly across platforms, with high webmail and mobile use.
- 79% of users check email primarily to access critical work messages; 41% also check for family/personal communication.
11.2 Work Email on Mobile: The "Infinite Workday" Effect
Microsoft's 2025 Work Trend Index—based on signals from 31,000+ workers across 31 countries—identified a structural transformation in how professionals relate to work email:
- 40% of employees check work email before 6 AM (primarily on smartphones)
- 29% return to work email by 10 PM (again, primarily on smartphones)
- 20% are actively working on weekends and checking work email before noon on Saturday and Sunday
- Average employees receive 117 emails and 153 Teams messages per day
- Workers are interrupted 275 times per day by digital communications
This data describes a phenomenon Microsoft terms the "infinite workday"—a continuous, mobile-enabled erosion of traditional work-hour boundaries. The smartphone is the primary enabling device. Without mobile email access, after-hours and weekend checking would require deliberate desktop login, creating natural friction and behavioral barriers.
11.3 Remote and Hybrid Workers
Among remote workers specifically, 81% check email outside standard work hours, and 63% work on weekends according to WorkTime 2026 data. SurveyMonkey's workplace communication data found that 85% of employees receive work-related communications outside standard hours at least a few times a month, and 58% respond at least a few times a week.
Hybrid workers—those splitting time between office and remote settings—report the highest engagement rates (35% highly engaged vs 33% remote-only, 27% in-office) according to Gallup 2024 data. This suggests hybrid workers are more active email users across devices, using desktop when in-office and mobile when remote.
12. Mobile Notifications and Interruptions
12.1 The Notification Volume Problem
Push notification volume has reached a level that behavioral researchers describe as actively harmful to cognitive performance. The average US smartphone user receives 46 app push notifications per day. Workers additionally receive 117 emails and 153 Teams/chat notifications daily (Microsoft 2025). The combined effect creates approximately 275 interruptions per day—roughly one every 2 minutes during waking hours.
University of California, Irvine research, widely cited in workplace studies, established that it takes approximately 23 minutes to regain deep focus after an interruption. Applied to a single 8-hour workday with 275 interruptions, the theoretical focus deficit is catastrophic—though in practice, users develop partial coping strategies (batching, Do Not Disturb modes, filtering) that partially mitigate the effect.
12.2 How Notifications Shape Email Checking Behavior
Push notifications from email apps create a compulsive checking loop on mobile devices that is absent on desktop. The mechanism:
- Notification arrives → user unlocks phone (average Americans unlock phones approximately 110 times per day)
- User reads notification preview → decides whether to open the email app
- Opening email app → typically triggers scanning of other recent messages, expanding the interruption
- User either replies briefly, marks as read, or flags for desktop follow-up
- Returns to previous task → with partial attention residue
A peer-reviewed PMC study (2023) confirmed that reducing notification-caused interruptions—specifically, batching notifications to three times per day—improved productivity with a moderate effect size. However, disabling notifications entirely showed mixed results, as some users compensated with increased self-interruption (proactive checking) and heightened anxiety about missed messages.
12.3 Notification Control: User Preferences
A 2024 Unily study of 500 UK employees found that 31% are distracted every 15 minutes by digital notifications, and 67% want more control over when and where they receive notifications. The desire is not to eliminate notifications but to have smarter, context-aware delivery—a problem that AI-powered notification management tools are beginning to address.
13. After-Hours Mobile Email Behavior
13.1 The Scale of After-Hours Engagement
After-hours email behavior is documented at scale by multiple independent sources, and the evidence is consistent: the smartphone has made email checking a continuous activity that extends well beyond traditional office hours.
Key statistics (2024–2026):
- 40% check work email before 6 AM (Microsoft Work Trend Index 2025, n=31,000+)
- 29% return to inbox by 10 PM (Microsoft 2025)
- 81% of remote workers check email outside work hours (WorkTime 2026)
- 85% of employees receive work comms outside standard hours (SurveyMonkey 2025)
- 58% respond to those communications at least a few times per week
- 20% check work email on Saturday and Sunday before noon (Microsoft 2025)
13.2 Impact on Work-Life Balance
SurveyMonkey's 2025 Work-Life Balance data reports that while 30% of workers expect after-hours communication and don't mind, and 25% feel appreciated when they receive after-hours comms, a notable segment experiences negative effects: 14% feel anxious or stressed about after-hours communications, and 47% of remote workers are concerned about blurred work-life balance boundaries.
Academic research published in PMC (2025) confirms that the "always-on" culture enabled by mobile email access increases stress levels and reduces the ability to psychologically detach from work. The device enabling this is almost entirely the smartphone—a point with implications for notification design, organizational policy, and AI-assisted email management.
14. Productivity Differences Between Mobile and Desktop Email Management
14.1 The Speed-Depth Tradeoff
The most consistent behavioral finding across research sources is a fundamental tradeoff between mobile email speed and desktop email depth:
- Mobile delivers speed: faster initial opens, faster short replies, faster triage decisions
- Desktop delivers depth: longer replies, more thorough search, more systematic organization, better task completion
The USC Viterbi study found that mobile users respond almost twice as fast as laptop users, but their replies contain significantly fewer words and less substantive content. Mobile replies trend toward 43 words or fewer; more than 30% of full email replies exceed 100 words, and these are disproportionately composed on desktop.
14.2 Mobile's Contribution to Shallow Processing
The high-frequency, notification-driven email checking pattern on mobile encourages a shallow processing mode: scan, assess urgency, mark as read or briefly reply, move on. This is efficient for triage but counterproductive for complex professional communication. Key behavioral signatures of shallow mobile email processing:
- Higher rates of "mark as read without acting" on mobile
- Higher rates of leaving emails flagged or starred for later desktop attention
- Lower rates of thorough unsubscribing, folder creation, or filter setup
- Emails addressed in brief mobile replies often require follow-up desktop clarification
14.3 Desktop's Deep Work Alignment
Desktop email sessions are typically longer, more deliberate, and more organizationally productive. They align with structured "email processing" behavior—clearing multiple emails in a batch, applying consistent organizational logic, and composing substantive responses. The inability to be interrupted by push notifications while working in a desktop email client (unless notifications are enabled) also contributes to more focused sessions.
Workers who designate specific "email processing" blocks during desktop work hours and limit mobile email checking to off-desk contexts report higher email efficiency and lower email-related stress—a finding supported by the UC Irvine interruption research and the PMC notification study.
15. AI, Automation, and Smart Inbox Tools by Device
15.1 Current Adoption Landscape
Artificial intelligence in email management has transitioned from experimental to mainstream in 2025–2026. Key adoption statistics:
- 25% of inboxes actively use AI to summarize, categorize, or prioritize email (cloudHQ 2026)
- 40% of business users use smart reply or AI drafting tools at least weekly (cloudHQ 2026)
- AI-assisted inbox management reduces average email response time by 18% (cloudHQ 2026)
- 85% of companies are expected to have adopted AI email tools by end of 2025 (Clean Email 2026)
- 92% of Fortune 500 companies now use AI technologies, with significant application to email workflows
- 80% of professionals have experimented with AI in work contexts (Owl Labs 2025)
- AI assistant market: $810M in 2024, growing to $2.38 billion by 2035 at a CAGR of 10.4%
15.2 AI Tools by Device Context
AI email features are available on both mobile and desktop but are used differently across environments:
On mobile:
- Smart reply suggestions (one-tap short responses) are heavily used for speed
- AI notification summaries reduce the cognitive load of deciding whether to open an email
- Gemini AI (Gmail mobile) and Apple Intelligence summaries provide inbox digests
- Voice-to-text email composition via AI is growing on mobile platforms
On desktop:
- AI drafting tools (Outlook Copilot, Gmail Gemini) assist with long-form reply composition
- Smart categorization and email triage automation runs in the background
- AI thread summarization saves time when returning to long conversation chains
- Automated filter creation and unsubscribe management are predominantly desktop behaviors
15.3 The Automation-Device Shift Hypothesis
As AI inbox management matures, it may reduce the behavioral differentiation between mobile and desktop email. If AI can triage, summarize, and draft responses autonomously—whether the user is on mobile or desktop—the device-based task splits described in this report may become less pronounced. This is a central variable in the 2030 forecast scenarios below.
16. Mobile vs Desktop Comparison: Email Actions in Detail
16.1 Reading Emails
Mobile is the dominant reading environment, driven by notification-triggered sessions. Reading behavior on mobile is characterized by scanning subject lines, previewing first sentences, and making quick relevance judgments. The average time spent reading an email on mobile is approximately 10 seconds. Desktop reading tends to be more attentive, deeper, and associated with work-hour processing blocks.
16.2 Writing Replies
Desktop is strongly preferred for substantive replies. Only 37% of users prefer composing detailed replies on mobile. The reasons are practical: virtual keyboards are slower than physical ones, mobile screens make it harder to reference quoted text, and the mobile context (commuting, breaks) discourages long-form writing. Emails between 74–100 words show the highest response rates—a length achievable on mobile but more comfortable on desktop.
16.3 Searching for Old Emails
Desktop dominates email search. Advanced search operators, the ability to type quickly, and larger result displays make desktop the more effective search environment. Gmail's full-text search works on mobile but is significantly less usable due to screen constraints and slower on-screen keyboard input.
16.4 Deleting and Archiving
Mobile handles quick deletion and archiving through swipe gestures (available in Gmail, iOS Mail, Outlook Mobile). However, bulk deletion and systematic archiving—selecting 50+ emails at once, applying rules, or creating archive folders—are strongly desktop behaviors. The touchscreen interaction model makes bulk operations on mobile awkward and error-prone.
16.5 Unsubscribing
Unsubscribing is predominantly a desktop behavior. The process typically requires: locating the unsubscribe link (often small and hard to tap on mobile), navigating to a landing page, confirming the action, and sometimes managing email preferences in a web form. Each step is more reliable on desktop. Mobile "Unsubscribe" buttons in Gmail or Outlook apps simplify this, but comprehensive list unsubscription is more commonly done during dedicated desktop cleanup sessions.
16.6 Bulk Cleanup
Desktop overwhelmingly. Bulk cleanup tools (Clean Email, Superhuman, native Gmail/Outlook bulk operations) require browser access or desktop clients for full functionality. Users who do periodic inbox cleanup—selecting and archiving entire year's worth of newsletters, deleting old promotional emails by sender—do this almost exclusively on desktop.
16.7 Managing Folders and Labels
Desktop is the creation and management environment for folder structures and labels. Mobile clients allow applying existing labels and moving emails to folders, but creating new organizational structures, editing filter rules, and building complex inbox architectures is a desktop task.
16.8 Handling Attachments
Desktop is strongly preferred. Mobile can open common attachment types (PDF, images, Word documents) but saving, editing, re-attaching, and managing file versions requires desktop file system access in most professional workflows. Mobile is sufficient for reviewing an attachment; desktop is required for working with it.
16.9 Using AI Email Features
Both devices, differently. Smart replies and AI notification digests are mobile-native features. AI drafting assistants (Copilot, Gemini, Superhuman AI) are more commonly used on desktop for long-form composition. As AI features mature on mobile, this gap may narrow—particularly for knowledge workers on hybrid schedules who compose substantive emails on mobile more than current data suggests.
Read more in our Email Productivity Statistics Report.
17. Trend Analysis: How Email Behavior Has Evolved
17.1 The Mobile Takeover: 2012–2022
The shift from desktop-dominated to mobile-dominated email access occurred rapidly between 2012 and 2022:
| Year | Mobile Opens % | Desktop Opens % | Webmail Opens % | Source |
|---|---|---|---|---|
| 2012 | 7–29% | 34% | 29–37% | Litmus / Return Path |
| 2014 | ~20% | ~30% | ~32% | Litmus historical |
| 2017 | 55% | 16% | 29% | Return Path |
| 2018 | 43–50% | 19–39% | 23–38% | Multiple (range reflects methods) |
| 2022 | 72% | 16% | 12% | Litmus / ExpertBeacon |
| 2026 | 41.6% | 16.2% | 40.6% | Litmus / AuroraSendCloud |
The apparent decline in mobile from 72% (2022) to 41.6% (2026) is largely a measurement artifact driven by Apple Mail Privacy Protection (2021), which shifted significant iPhone email activity from "mobile tracked" to "Apple proxy processed" categories. The actual behavioral reality—that most email is first accessed on mobile—has not reversed.
17.2 Desktop: Decline, Stabilization, and Specialization
Desktop email opens peaked at approximately 34% in 2012 and stabilized around 16–20% through 2022–2026. The rate of decline has slowed considerably, suggesting desktop has found its sustainable role: the deep-work, professional-task email environment that mobile cannot adequately replace.
Enterprise software investment in desktop email clients continues. The email client software market is projected to grow from $5.77 billion in 2024 to $9.9 billion by 2032. Microsoft Outlook, while holding only 4.38% of total email opens, is embedded in the enterprise workflows of millions of knowledge workers globally.
17.3 The Webmail Renaissance
Webmail (browser-based email access, primarily Gmail) has seen a surprising resurgence in the 2024–2026 data. At 40.6% of email opens in 2026, webmail nearly matches mobile—reflecting the growth of browser-based work on Chromebooks, the shift toward web-first productivity tools (Google Workspace), and the continued popularity of Gmail's web interface across both professional and consumer segments.
17.4 How Hybrid Work Changed Cross-Device Email
The COVID-19 pandemic's shift to remote work (2020–2022) and the subsequent hybrid stabilization (2022–2026) fundamentally altered cross-device email behavior. Key changes:
- Mobile email use expanded further into work contexts. Remote workers adopted smartphone email as a primary work tool when away from their home office desk.
- After-hours email checking intensified. The absence of physical commute created an "always-home" context where mobile email checking extended into evenings and mornings.
- Cross-device switching became more deliberate. Hybrid workers explicitly manage the transition between mobile (for away-from-desk access) and desktop (for focused work), creating more conscious device-based email habits.
- Notification management became a professional skill. High rates of digital interruption in remote and hybrid contexts pushed workers toward notification management strategies that were less necessary in office environments.
18. Forecast to 2030
Note: All projections in this section are modeled estimates based on historical trends, current adoption data, and stated assumptions. They are not guaranteed outcomes. Evidence-based projections are marked (EBP); original reasoned estimates are marked (ORE).
18.1 Forecast Methodology
The 2030 forecasts are derived from:
- Historical adoption curves for mobile email (2012–2026 Litmus/Radicati data)
- AI adoption rate modeling based on cloudHQ 2026, MRFR market data, and enterprise AI deployment surveys
- Generational replacement modeling (Gen Z replacing Baby Boomers in the workforce between 2025–2030)
- Hybrid work stabilization assumptions based on Gallup, ONS, and McKinsey data
- Smartphone penetration forecasts from GSMA and Pew Research
Three scenarios are modeled:
- Conservative: Slower AI maturation, continued desktop reliance for complex tasks, moderate mobile growth
- Moderate: Steady mobile and AI progress; smart inbox tools normalize; hybrid work stabilizes
- Aggressive: AI-first inbox management reaches majority adoption; mobile handles most email tasks; desktop email further specializes
18.2 Mobile Email Usage (% primarily mobile)
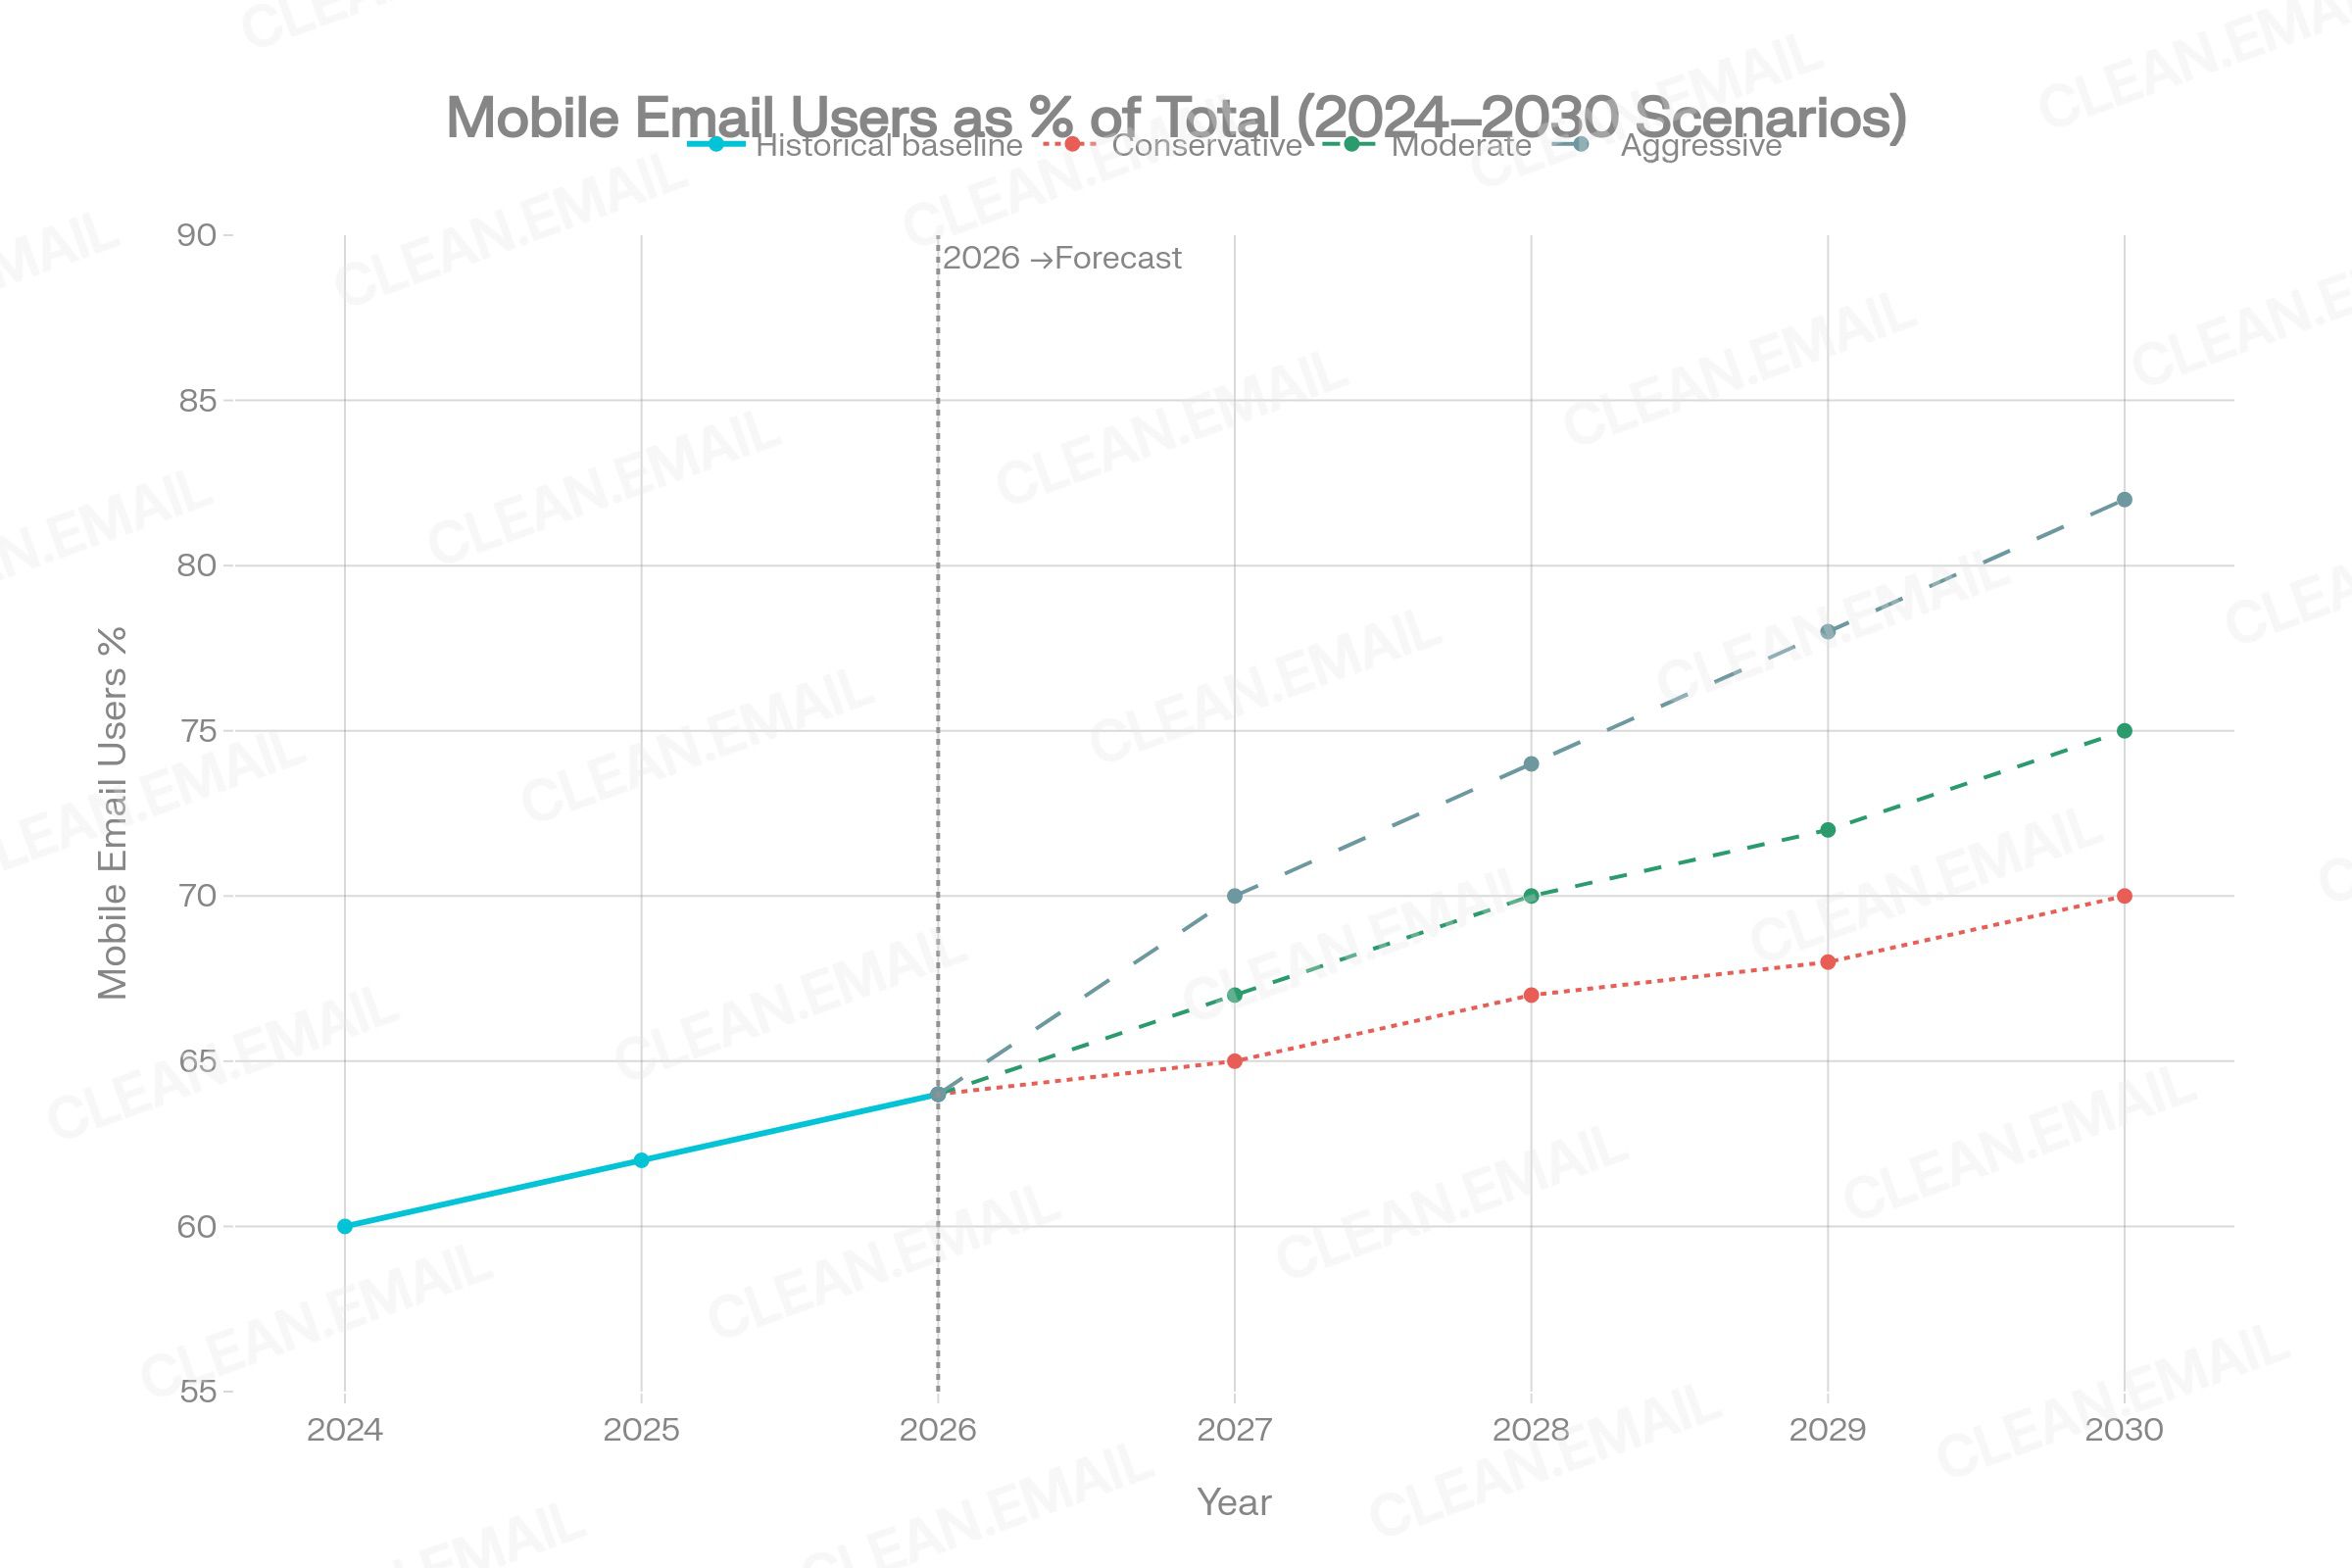
Current baseline (2026): 54–68% primarily mobile
- Conservative 2030: 70–72% primarily mobile. Mobile growth slows as desktop's specialized role becomes more entrenched.
- Moderate 2030: 75–77% primarily mobile. Steady generational shift as Gen Z and Millennials dominate the workforce.
- Aggressive 2030: 82–85% primarily mobile. AI eliminates the need for desktop for most email tasks; mobile becomes nearly universal primary access.
Assumption: Gen Z (67% mobile) and Millennials (59% mobile) increase their share of the professional workforce between 2026–2030, while Baby Boomers (36% mobile) progressively retire. (EBP)
18.3 Desktop Email Shares
Current baseline (2026): 16.2% of email opens tracked to desktop
- Conservative 2030: 14–16%. Desktop stabilizes as a specialized enterprise tool.
- Moderate 2030: 12–14%. Continued gradual decline as webmail and mobile grow.
- Aggressive 2030: 8–11%. Desktop email becomes a niche tool primarily used in regulated industries (legal, finance, healthcare) where desktop client security controls are mandated.
Assumption: Enterprise collaboration tools (Teams, Slack) continue absorbing some desktop email volume, reducing desktop email's share without eliminating it. (EBP/ORE)
18.4 AI-Managed Inbox Share
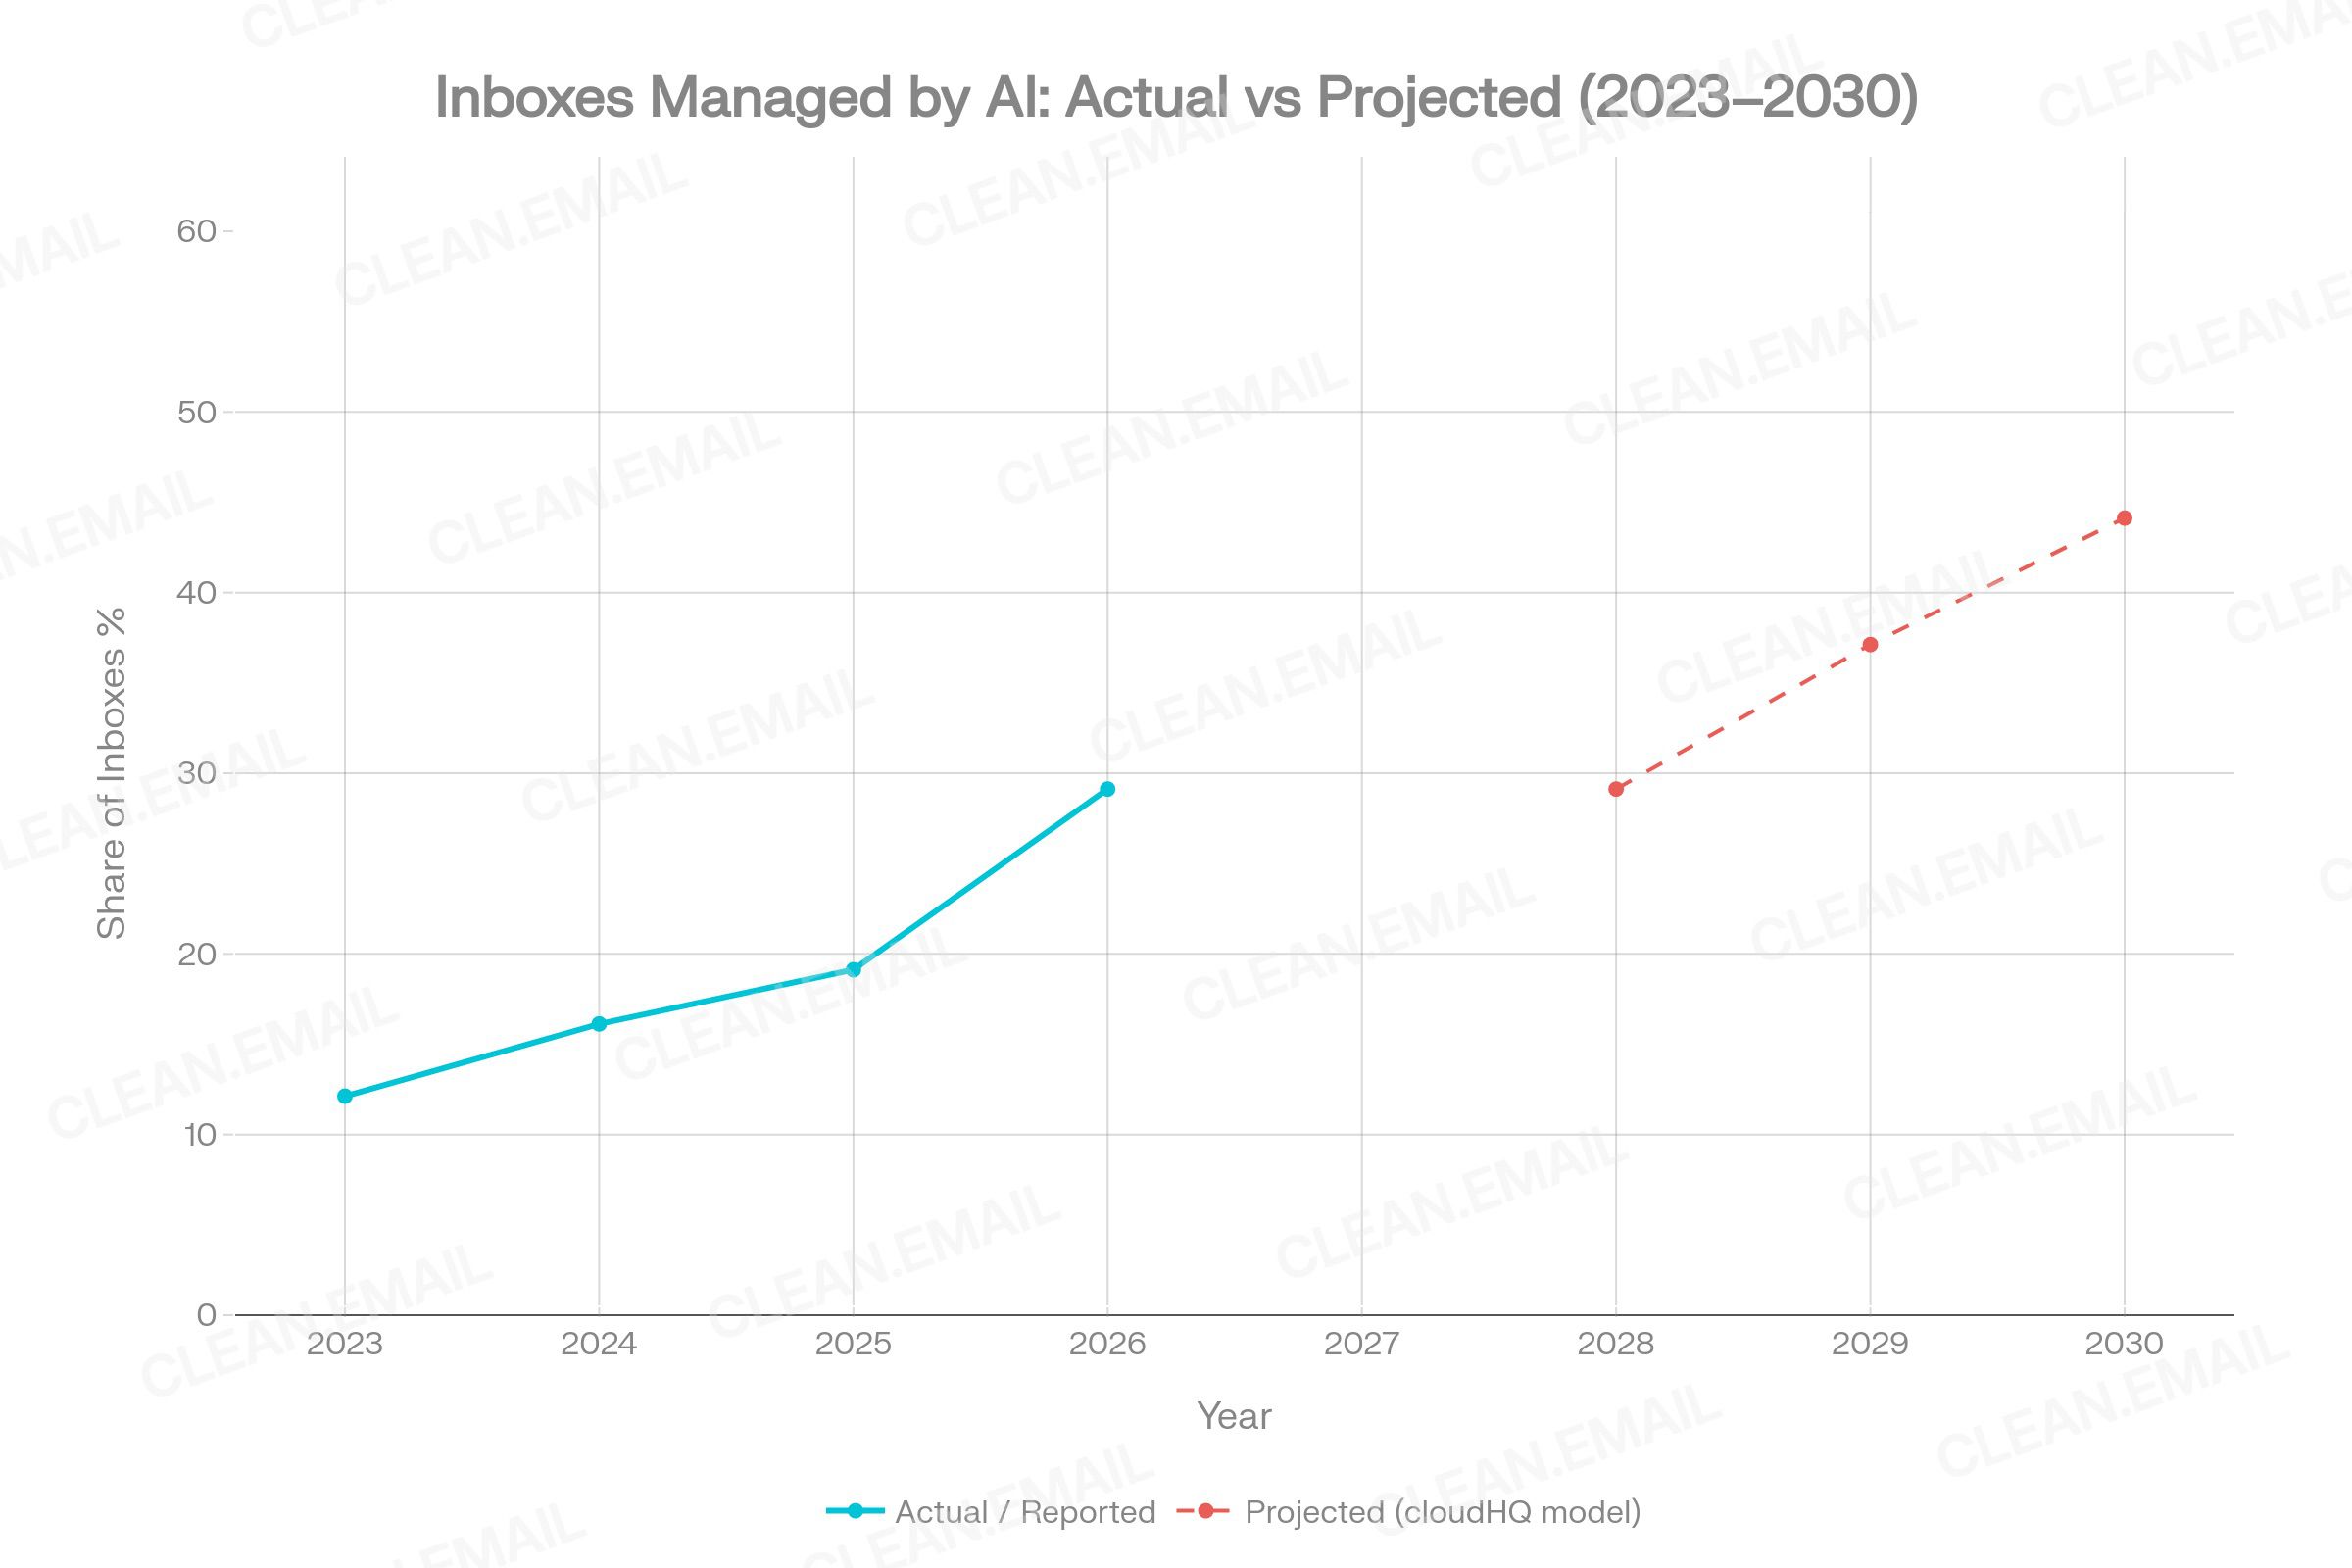
Current baseline (2025–2026): 25% of inboxes actively use AI
- Conservative 2030: 35–40%. AI tools are widely available but adoption is uneven; many users continue manual email management.
- Moderate 2030: 48–52%. AI reaches near-majority adoption. Most major email clients (Gmail, Outlook, Apple Mail) have AI features enabled by default.
- Aggressive 2030: 60–70%. AI-first inbox management—where AI handles triage, categorization, and routine replies autonomously—becomes the dominant mode.
Key assumption from cloudHQ: 15% of inboxes managed by AI in 2025, projected 50% by 2030 at current trajectory. (EBP)
Key risk to aggressive scenario: User trust, privacy concerns, and the preference for direct inbox control may slow AI adoption even when tools are available. Survey data shows significant segments of users remain resistant to AI-generated email replies. (ORE)
18.5 After-Hours Email Checking
Current baseline (2025–2026): 40% check before 6 AM; 29% return to inbox by 10 PM; 81% of remote workers check off-hours
- Conservative 2030: Slight reduction to ~35–37% pre-6 AM checking, driven by AI intelligent notification filtering and growing organizational "right to disconnect" policies. Mobile notifications become smarter about when to alert.
- Moderate 2030: ~30–35% pre-6 AM. AI prioritization means genuinely urgent emails surface while low-priority messages are held—reducing compulsive checking without eliminating it.
- Aggressive 2030:<25% pre-6 AM. AI confidently filters and responds to most after-hours emails, making human after-hours checking less necessary.
Key uncertainty: Organizational culture, not just technology, drives after-hours behavior. Policy changes (such as "right to disconnect" legislation expanding in EU, France, Ireland) may reduce after-hours mobile checking independently of technology. (ORE)
18.6 Cross-Device Switching
Current baseline: ~65% start on mobile, switch to desktop for completion
- Conservative 2030: 60–65% still switch. Desktop remains necessary for complex tasks.
- Moderate 2030: 50–55% switch. Improved mobile email interfaces and AI reduce the need for device switching for moderately complex tasks.
- Aggressive 2030: 35–40% switch. AI-powered mobile email handles most tasks that previously required desktop; only highly complex workflows require switching.
Key driver: Foldable phones and large-screen mobile devices (growing category through 2030) may close the screen-size gap that currently makes some email tasks impractical on mobile. (ORE)
19. 2030 Prediction Table
| Metric | 2024–2026 Baseline | Conservative 2030 | Moderate 2030 | Aggressive 2030 | Reasoning |
|---|---|---|---|---|---|
| % primarily accessing email on mobile | 54–68% | 70–72% | 75–77% | 82–85% | Generational workforce shift; Gen Z majority |
| Desktop share of email opens (tracked) | 16.2% | 14–16% | 12–14% | 8–11% | Enterprise specialization vs. AI displacement |
| AI-managed inboxes (% of total) | ~25% | 35–40% | 48–52% | 60–70% | cloudHQ trajectory model; enterprise adoption rates |
| % checking email before 6 AM | ~40% | 35–38% | 28–33% | <25% | AI filtering reduces compulsive checks |
| % cross-device switchers (mobile → desktop) | ~65% | 60–65% | 50–55% | 35–40% | Improved mobile UI; AI; foldable devices |
| After-hours email checking (% off-hours) | 81% remote / 85% all | 75–78% | 65–70% | 50–55% | AI filtering + policy + notification management |
| Daily email checking frequency (mobile) | ~6x/day | 5–6x/day | 4–5x/day | 3–4x/day | Smarter notifications reduce compulsive checks |
| Mobile email market size | $12.17B (2023) | ~$22B | ~$26B | ~$30.4B+ | CAGR 13.9% mid-case projection |
| Inboxes using smart reply weekly | ~40% business users | 55–60% | 65–70% | 80–85% | Adoption curve based on 2023–2026 growth |
| Global email users | 5.02B (2026) | 5.5B | 5.6B | 5.7B | Radicati / cloudHQ population growth models |
20. Practical Implications
20.1 For Regular Email Users
- Designate device roles consciously. Use mobile for triage and quick responses; reserve desktop for complex replies, bulk cleanup, and folder management. This behavioral split is already what most users do implicitly—making it explicit reduces cognitive load and email-related stress.
- Manage notifications actively. Batch notifications to 2–3 times per day rather than receiving real-time alerts. Research confirms this reduces interruptions without materially increasing response times for most professional correspondence.
- Use AI features strategically on mobile. AI smart replies on mobile are appropriate for acknowledging, confirming, or brief responses. Substantive professional communication should still be composed on desktop.
20.2 For Remote and Hybrid Workers
- Establish device boundaries for work email. The smartphone's role in enabling after-hours email access is the primary driver of work-life boundary erosion. Organizational policies that distinguish between "available on mobile" and "always responsive on mobile" can reduce burnout without reducing connectivity.
- Leverage hybrid office days for desktop email processing. In-office days with dedicated desktop access are well-suited for systematic inbox cleanup, folder management, and substantive email composition that is impractical in mobile-only remote contexts.
- Consider "right to disconnect" behavior. 58% of workers respond to after-hours messages at least a few times a week. Studies suggest workers who set intentional response windows—and use AI to filter urgency—maintain similar professional effectiveness while improving wellbeing.
20.3 For SaaS and Email Productivity Tools
- Build for cross-device continuity. The 65% of users who switch from mobile to desktop mid-email-task need seamless handoff: starred emails visible on desktop, flagged threads synced instantly, and draft states preserved.
- AI triage must work well on mobile. Since mobile is the first-touch device for most emails, AI that accurately identifies priority messages on mobile prevents low-urgency notifications from triggering unnecessary session starts.
- Notification intelligence is a differentiating feature. Users want smarter notifications, not fewer tools. Products that give contextual control over when email alerts fire—respecting focus time, time zones, and conversation urgency—address the highest user friction point.
20.4 For Mobile App Developers
- Optimize for the 10-second read. The average mobile email reading session is approximately 10 seconds. App design should prioritize scan-readability: large sender names, clear subject previews, and one-tap action buttons for the most common behaviors (archive, delete, reply briefly).
- Improve bulk actions on mobile. The single biggest desktop advantage in inbox management is bulk processing. Mobile apps that implement accessible multi-select, batch archive, and category-based clearing significantly reduce the desktop-switch trigger for cleanup tasks.
- Design for the cross-device handoff moment. When a user flags an email on mobile, the desktop experience should surface that email prominently. Seamless cross-device sync is table-stakes for professional email app users.
20.5 For Content Marketers Writing About Email Statistics
- Distinguish device tracking data from behavioral surveys. The 41.6% mobile opens figure (Litmus client tracking) and the 64–68% "primarily use mobile" survey figures are measuring different things. Both are valid; neither is wrong. Citing them as conflicting is a misreading of the methodology.
- Note Apple Mail Privacy Protection in all open-rate discussions. Any email statistics covering 2021–2026 that include open rate or device share data may be affected by MPP's automatic pixel pre-fetching. This affects both the absolute numbers and device-specific breakdowns.
- Use 2024–2026 data as the baseline. Statistics from 2018–2020 are historical. The device landscape, hybrid work context, and AI availability in 2024–2026 create fundamentally different conditions that make older behavioral data poor proxies for current behavior.
21. Data Gaps and Research Limitations
The following gaps represent areas where this report could not find sufficient credible primary data:
- Device-segmented inbox management behavior at scale. No large-scale study specifically measures what percentage of archiving, filtering, and bulk cleanup actions occur on mobile versus desktop. Most behavioral analytics measure opens and clicks, not organizational actions.
- Longitudinal cross-device switching rates. The 65% switching figure cited from EmailMonday/Genesys is widely quoted but its primary methodology is not fully disclosed. Rigorously designed longitudinal studies of cross-device email switching are needed.
- Regional device preference data. Most device preference data is US- or UK-centric. In markets with lower desktop PC penetration (sub-Saharan Africa, Southeast Asia, parts of South Asia), mobile-only email usage may be substantially higher. The ZeroBounce survey covered 6 countries; global coverage would strengthen the analysis.
- Device preference by industry or role. Limited data exists on how email device preferences differ between, for example, a software engineer (likely high desktop use), a field sales representative (likely high mobile use), and a C-suite executive (likely hybrid). Industry segmentation would be valuable.
- AI adoption rates by device. Current AI email statistics measure adoption across devices combined. Device-specific data on whether AI features are activated and used more on mobile versus desktop is not yet systematically published.
- Email response length and quality by device. The USC 2015 study is the most-cited source on this, but it is a decade old. A contemporary, large-scale replication—particularly post-AI-smart-reply—would significantly strengthen the mobile-depth/desktop-depth analysis.
- Tablet email behavior. Tablets represent 3–9% of mobile email opens and are consistently the least-researched device category. Their role in cross-device email management is understudied, particularly for use cases where screen size matters (attachment review, long-form composition).
Source Index
All sources cited in this report are listed below. Access dates reflect April 2026.
| # |
|---|
| 1 |
| 2 |
| 3 |
| 4 |
| 5 |
| 6 |
| 7 |
| 8 |
| 9 |
| 10 |
| 11 |
| 12 |
| 13 |
| 14 |
| 15 |
| 16 |
| 17 |
| 18 |
| 19 |
| 20 |
| 21 |
| 22 |
| 23 |
| 24 |
| 25 |
| 26 |
| 27 |
| 28 |
| 29 |
| 30 |
| 31 |
| 32 |
| 33 |
| 34 |
| 35 |
| 36 |
| 37 |
| 38 |
| 39 |
| 40 |
| 41 |
| 42 |
| 43 |
| 44 |
| 45 |
| 46 |
| Source | Organization | URL |
|---|---|---|
| Email Device Usage Insights 2026 | AuroraSendCloud | https://www.aurorasendcloud.com /blog/email-device-usage-insights |
| Email Client Market Share 2026 | AuroraSendCloud | https://www.aurorasendcloud.com /blog/email-client-market-share |
| Email Statistics Report 2024–2028 (Exec. Summary) | Radicati Group | https://www.radicati.com /wp/wp-content/uploads/2024/10/Email-Statistics-Report-2024-2028-Executive-Summary.pdf |
| Radicati Group Press Release 2024–2028 | Radicati Group | https://www.einpresswire.com /article/751597875/the-radicati-group-releases-email-statistics-report-2024-2028 |
| How Many Emails Are Sent Per Day (Fresh Data 2026) | EmailTooltester | https://www.emailtooltester.com /en/blog/how-many-emails-are-sent-per-day/ |
| Into the Inbox: Email Statistics 2026 | ZeroBounce | https://www.zerobounce.net /email-statistics-report |
| Email Statistics Report 2025–2030 | cloudHQ | https://blog.cloudhq.net /email-statistics-report-2025-2030/ |
| Mobile vs Desktop Email: 2025 Inbox Management Stats | Emailsorters | https://www.emailsorters.com /blog/mobile-vs-desktop-email-inbox-stats/ |
| Mobile Email Engagement — 32 Statistics | Genesys Growth | https://genesysgrowth.com /blog/mobile-email-engagement-stats-for-marketing-leaders |
| New Microsoft Study: Rise of the Infinite Workday | Microsoft | https://news.microsoft.com /de-ch/2025/06/17/new-microsoft-study |
| Work-Life Balance Statistics 2025 | SurveyMonkey | https://www.surveymonkey.com /curiosity/work-life-balance-statistics/ |
| Remote Work Statistics 2026 | WorkTime | https://www.worktime.com /blog/statistics/remote-work-statistics |
| Email Client Statistics 2025 | SalesSo | https://salesso.com /blog/email-client-statistics/ |
| Email Client Market Share: Trends & Statistics 2026 | Litmus | https://www.litmus.com /email-client-market-share/ |
| Litmus: Email Client Market Share March 2025 | Litmus / LinkedIn | https://www.linkedin.com /posts/chameleoncrm_emailmarketing |
| 40+ Email Marketing Statistics for 2026 | OptinMonster | https://optinmonster.com /email-marketing-statistics/ |
| 100 Compelling Email Statistics for 2026 | Porch Group Media | https://porchgroupmedia.com /blog/100-compelling-email-statistics-to-inform-your-strategy-in-2023/ |
| How Many Emails Are Sent Per Day | Hostinger | https://www.hostinger.com /blog/how-many-emails-are-sent-per-day |
| Email Usage Statistics: A Comprehensive Analysis | SEO Sandwitch | https://seosandwitch.com /email-usage-stats/ |
| Distracted Every 15 Minutes: Unily Research | Unily / People Management | https://www.intelligentcxo.com /2024/07/03/distracted-every-15-minutes-unily-research-exposes-workplace-digital-noise-crisis/ |
| Effects of Task Interruptions Caused by Notifications (PMC) | PMC / Academic | https://pmc.ncbi.nlm.nih.gov /articles/PMC10244611/ |
| Beyond the Buzz: Notification Disabling Study | Tandfonline / Academic | https://www.tandfonline.com /doi/full/10.1080 /15213269.2024.2334025 |
| Americans' Use of Mobile Technology | Pew Research Center | https://www.pewresearch.org /internet/2024/01/31/americans-use-of-mobile-technology-and-home-broadband/ |
| Pew Mobile Fact Sheet | Pew Research Center | https://www.pewresearch.org /internet/fact-sheet/mobile/ |
| Email Productivity Benchmark Report | EmailAnalytics | https://emailanalytics.com /email-productivity-benchmark-report/ |
| Factors That Affect Email Response Time (USC) | Phys.org / USC Viterbi | https://phys.org /news/2015-10-factors-affect-email-response.html |
| State of Hybrid Work 2025 | Owl Labs | https://owllabs.com /state-of-hybrid-work/2025 |
| Push Notifications Statistics 2025 | Business of Apps | https://www.businessofapps.com /marketplace/push-notifications/research/push-notifications-statistics/ |
| AI Email Assistant Market | Market Research Future | https://www.marketresearchfuture.com /reports/ai-email-assistant-market-12206 |
| Email Statistics Report 2026 | SMTP2GO | https://www.smtp2go.com /blog/email-usage-key-trends-for-2025-and-beyond/ |
| Majority of Emails Opened on Mobile | CDG / Return Path | https://cdg.us /majority-of-emails-now-opened-on-mobile-devices/ |
| Mobile vs Desktop Email Engagement | Growth-onomics | https://growth-onomics.com /mobile-vs-desktop-email-engagement-metrics/ |
| Emails Are Still King: 2025 Data | Signite.io | https://www.signite.io/emails-are-still-king/ |
| Worldwide Mobile Email Market Research 2025 | P Market Research | https://pmarketresearch.com /worldwide-mobile-email-market-research |
| Email Industry Data Report 2025–2026 | Clean Email | https://clean.email /blog/insights/email-industry-report-2026 |
| Technology-Mediated Interruptions and Work-Life Balance | Univ. of Arkansas / Walton | https://walton.uark.edu /insights/posts/technology-mediated-interruptions-and-work-life-balance.php |
| Dual Impact of Digital Connectivity (PMC) | PMC / Academic | https://pmc.ncbi.nlm.nih.gov /articles/PMC12192724/ |
| Email Marketing Report 2026–2030 | Verified.email | https://verified.email /blog/email-marketing/email-marketing-research-report-2026-2030 |
| Mobile Emails Dominate Global Communications | ExpertBeacon | https://expertbeacon.com /mobile-email-statistics/ |
| Time Spent Using Smartphones (2026) | Exploding Topics | https://explodingtopics.com /blog/smartphone-usage-stats |
| Smartphones in 2024: Usage Time | Telefonica | https://www.telefonica.com /en/communication-room/blog/smartphones-2024/ |
| Email Client Software Market | Credence Research / Yahoo Finance | https://finance.yahoo.com /news/email-client-software-market-reach-190800606.html |
| 15 Email Overload Statistics | Readless.app | https://www.readless.app /blog/email-overload-statistics |
| Mobile Email Statistics: Key Trends 2025 | SEO Sandwitch | https://seosandwitch.com /mobile-email-stats/ |
| Mobile Email Statistics 2025 | TrueList | https://truelist.co /blog/mobile-email-statistics/ |
| How Smartphones Shape Email Engagement | Crafium / Stripo | https://crafium.com /mobile-email-statistics/ |


